

Chart of year Bad Tölz / Ellbach
Discharge from 01.01.2019 to 31.12.2019
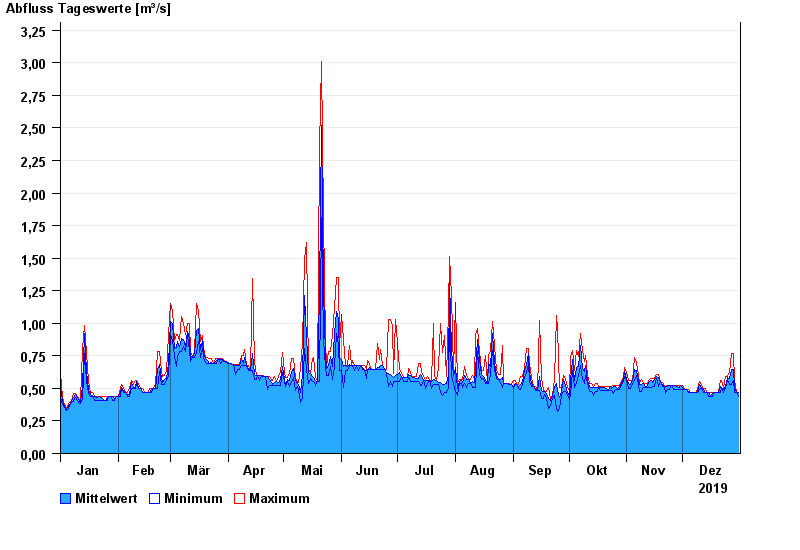
| Date | Mean value [m³/s] | Maximum [m³/s] | Minimum [m³/s] |
|---|---|---|---|
| 31.12.2019 | 0.468 | 0.468 | 0.44 |
| 30.12.2019 | 0.468 | 0.468 | 0.468 |
| 29.12.2019 | 0.51 | 0.558 | 0.468 |
| 28.12.2019 | 0.644 | 0.768 | 0.558 |
| 27.12.2019 | 0.645 | 0.768 | 0.527 |
| 26.12.2019 | 0.577 | 0.623 | 0.527 |
| 25.12.2019 | 0.581 | 0.59 | 0.557 |
© Bayerisches Landesamt für Umwelt 2024