

Chart of year Bad Tölz / Ellbach
Discharge from 01.01.2024 to 25.04.2024
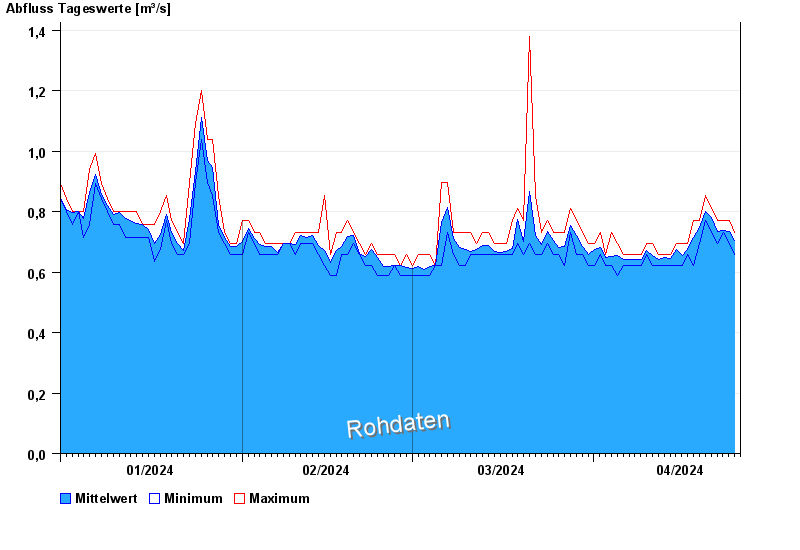
| Date | Mean value [m³/s] | Maximum [m³/s] | Minimum [m³/s] |
|---|---|---|---|
| 25.04.2024 | 0.71 | 0.73 | 0.693 |
| 24.04.2024 | 0.733 | 0.769 | 0.693 |
| 23.04.2024 | 0.739 | 0.769 | 0.73 |
| 22.04.2024 | 0.735 | 0.769 | 0.693 |
| 21.04.2024 | 0.78 | 0.811 | 0.73 |
| 20.04.2024 | 0.802 | 0.853 | 0.769 |
| 19.04.2024 | 0.748 | 0.769 | 0.693 |
© Bayerisches Landesamt für Umwelt 2024