

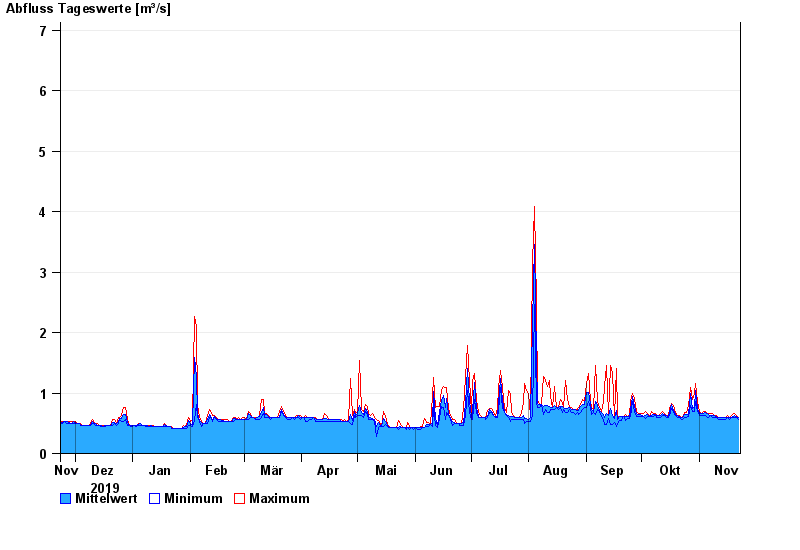
Chart of year Bad Tölz / Ellbach
Discharge from 23.11.2019 to 22.11.2020
- 30.05.1940 Abfluss: 19,8 m³/s
- 23.07.1966 Abfluss: 11,8 m³/s
- 09.07.1954 Abfluss: 11,6 m³/s
- 07.07.1946 Abfluss: 9,23 m³/s
- 21.05.1999 Abfluss: 9,1 m³/s
| Date | Mean value [m³/s] | Maximum [m³/s] | Minimum [m³/s] |
|---|---|---|---|
| 22.11.2020 | 0.596 | 0.598 | 0.564 |
| 21.11.2020 | 0.617 | 0.632 | 0.597 |
| 20.11.2020 | 0.634 | 0.667 | 0.597 |
| 19.11.2020 | 0.611 | 0.667 | 0.596 |
| 18.11.2020 | 0.598 | 0.631 | 0.596 |
| 17.11.2020 | 0.595 | 0.596 | 0.563 |
| 16.11.2020 | 0.598 | 0.63 | 0.596 |
© Bayerisches Landesamt für Umwelt 2024