

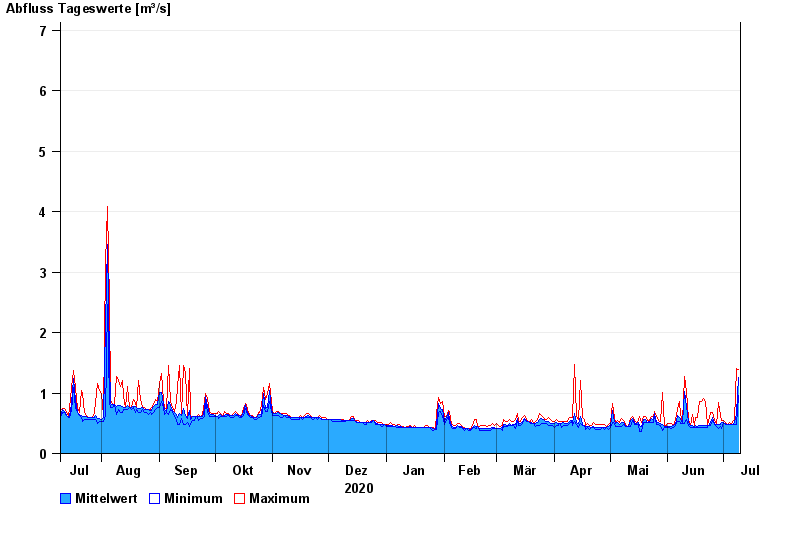
Chart of year Bad Tölz / Ellbach
Discharge from 10.07.2020 to 09.07.2021
- 30.05.1940 Abfluss: 19,8 m³/s
- 23.07.1966 Abfluss: 11,8 m³/s
- 09.07.1954 Abfluss: 11,6 m³/s
- 07.07.1946 Abfluss: 9,23 m³/s
- 21.05.1999 Abfluss: 9,1 m³/s
| Date | Mean value [m³/s] | Maximum [m³/s] | Minimum [m³/s] |
|---|---|---|---|
| 09.07.2021 | 1.26 | 1.39 | 0.951 |
| 08.07.2021 | 0.654 | 1.4 | 0.478 |
| 07.07.2021 | 0.51 | 0.548 | 0.478 |
| 06.07.2021 | 0.483 | 0.548 | 0.478 |
| 05.07.2021 | 0.478 | 0.478 | 0.478 |
| 04.07.2021 | 0.48 | 0.513 | 0.478 |
| 03.07.2021 | 0.479 | 0.479 | 0.479 |
© Bayerisches Landesamt für Umwelt 2024