

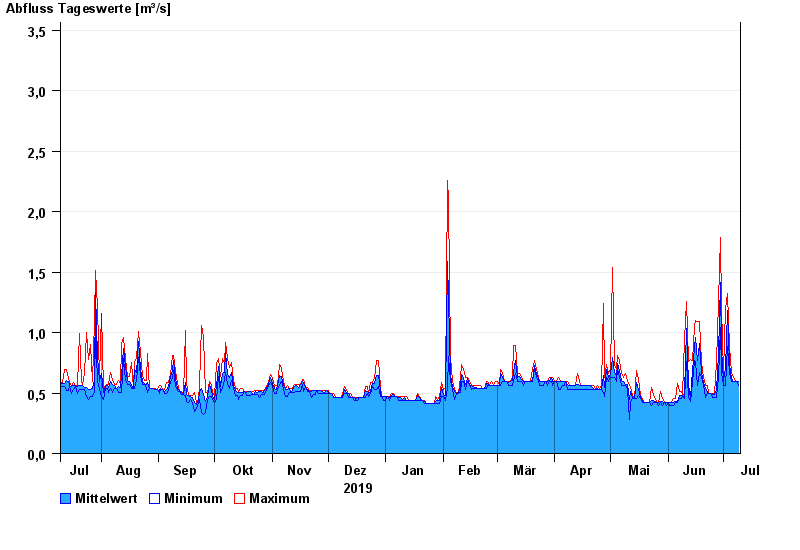
Chart of year Bad Tölz / Ellbach
Discharge from 10.07.2019 to 09.07.2020
- 30.05.1940 Abfluss: 19,8 m³/s
- 23.07.1966 Abfluss: 11,8 m³/s
- 09.07.1954 Abfluss: 11,6 m³/s
- 07.07.1946 Abfluss: 9,23 m³/s
- 21.05.1999 Abfluss: 9,1 m³/s
| Date | Mean value [m³/s] | Maximum [m³/s] | Minimum [m³/s] |
|---|---|---|---|
| 09.07.2020 | 0.593 | 0.595 | 0.559 |
| 08.07.2020 | 0.595 | 0.595 | 0.595 |
| 07.07.2020 | 0.595 | 0.595 | 0.595 |
| 06.07.2020 | 0.595 | 0.632 | 0.595 |
| 05.07.2020 | 0.618 | 0.67 | 0.595 |
| 04.07.2020 | 0.738 | 0.887 | 0.67 |
| 03.07.2020 | 1.18 | 1.32 | 0.887 |
© Bayerisches Landesamt für Umwelt 2024