

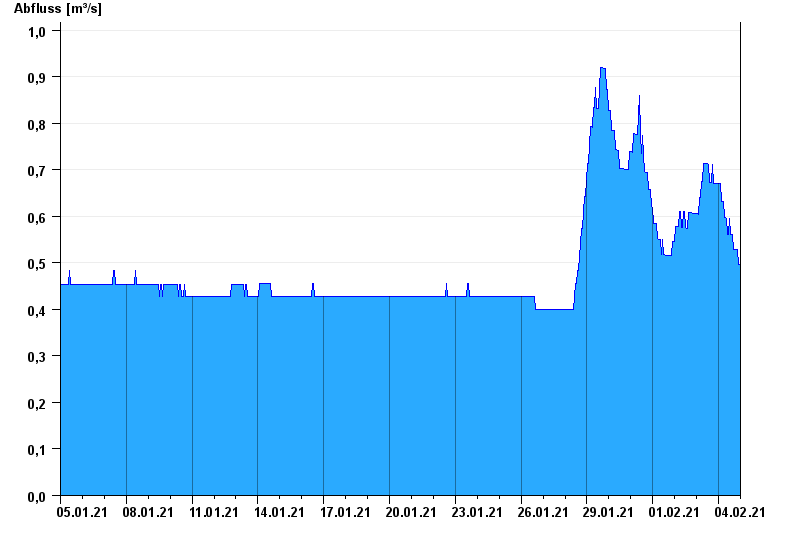
Chart of month Bad Tölz / Ellbach
Discharge from 05.01.2021 to 04.02.2021
- 30.05.1940 Abfluss: 19,8 m³/s
- 23.07.1966 Abfluss: 11,8 m³/s
- 09.07.1954 Abfluss: 11,6 m³/s
- 07.07.1946 Abfluss: 9,23 m³/s
- 21.05.1999 Abfluss: 9,1 m³/s
| Date | Runoff [m³/s] |
|---|---|
| 04.02.2021 23:45 | 0.497 |
| 04.02.2021 23:30 | 0.497 |
| 04.02.2021 23:15 | 0.497 |
| 04.02.2021 23:00 | 0.497 |
| 04.02.2021 22:45 | 0.497 |
| 04.02.2021 22:30 | 0.497 |
| 04.02.2021 22:15 | 0.497 |
© Bayerisches Landesamt für Umwelt 2024