
- Start >
- Rivers >
- Discharge >
- Isar >
- Bad Kreuth >
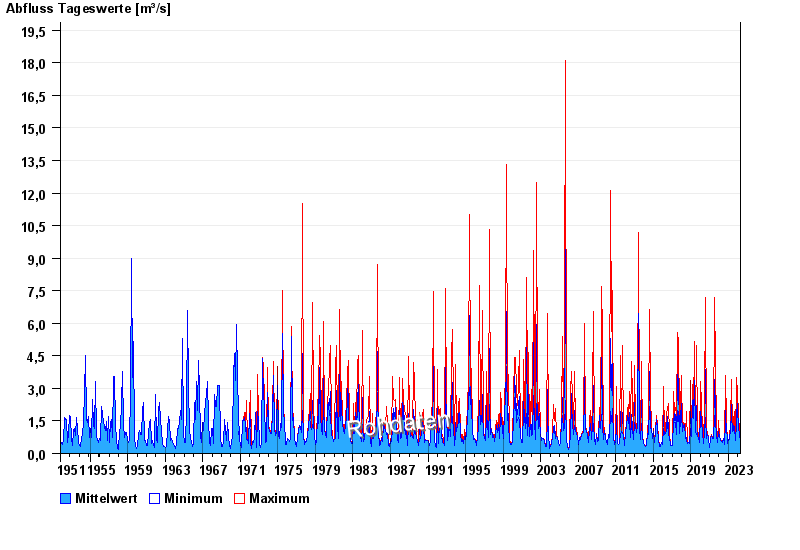
- Chart of total period

Chart of total period Bad Kreuth / Sagenbach
Discharge from 01.11.1951 to 19.04.2024
| Date | Mean value [m³/s] | Maximum [m³/s] | Minimum [m³/s] |
|---|---|---|---|
| 19.04.2024 | 0.466 | 0.517 | 0.465 |
| 18.04.2024 | 0.465 | 0.465 | 0.465 |
| 17.04.2024 | 0.465 | 0.465 | 0.465 |
| 16.04.2024 | 0.465 | 0.465 | 0.465 |
| 15.04.2024 | 0.465 | 0.465 | 0.465 |
| 14.04.2024 | 0.465 | 0.465 | 0.465 |
| 13.04.2024 | 0.465 | 0.465 | 0.465 |
© Bayerisches Landesamt für Umwelt 2024