
- Start >
- Rivers >
- Discharge >
- Isar >
- Bad Feilnbach >
- Chart of year

Chart of year Bad Feilnbach / Jenbach
Discharge from 01.01.2024 to 25.04.2024
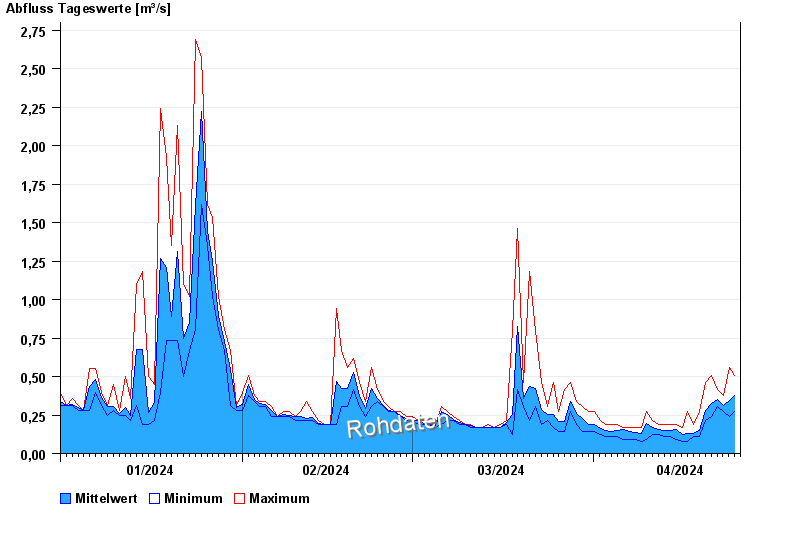
| Date | Mean value [m³/s] | Maximum [m³/s] | Minimum [m³/s] |
|---|---|---|---|
| 25.04.2024 | 0.346 | 0.418 | 0.305 |
| 24.04.2024 | 0.345 | 0.56 | 0.243 |
| 23.04.2024 | 0.31 | 0.378 | 0.272 |
| 22.04.2024 | 0.351 | 0.418 | 0.305 |
| 21.04.2024 | 0.323 | 0.509 | 0.243 |
| 20.04.2024 | 0.282 | 0.462 | 0.215 |
| 19.04.2024 | 0.149 | 0.272 | 0.108 |
© Bayerisches Landesamt für Umwelt 2024