
- Start >
- Rivers >
- Discharge >
- Isar >
- Bad Aibling Willinger Brücke >
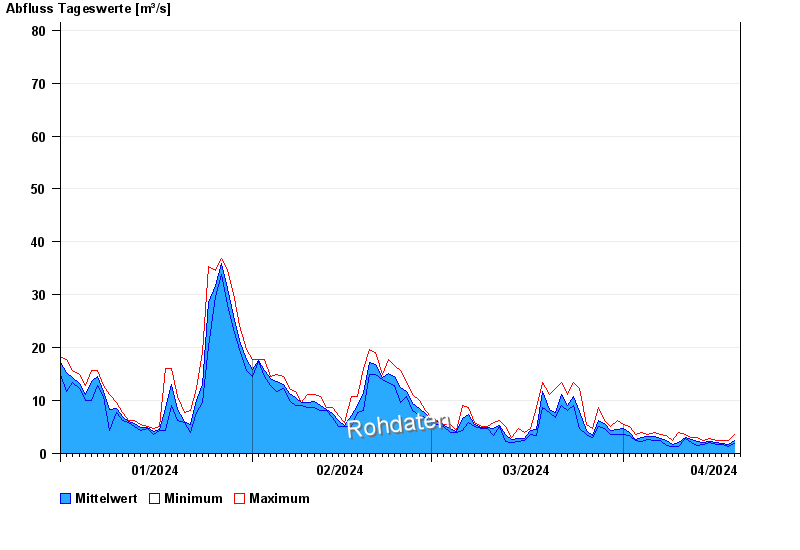
- Chart of year

Chart of year Bad Aibling Willinger Brücke / Mangfall
Discharge from 01.01.2024 to 19.04.2024
 Für diesen Pegel sind keine Jährlichkeiten hinterlegt.
| Date | Mean value [m³/s] | Maximum [m³/s] | Minimum [m³/s] |
|---|---|---|---|
| 19.04.2024 | 1.83 | 1.83 | 1.83 |
| 18.04.2024 | 1.72 | 2.51 | 1.29 |
| 17.04.2024 | 1.84 | 2.51 | 1.63 |
| 16.04.2024 | 1.83 | 2.23 | 1.41 |
| 15.04.2024 | 2.09 | 2.47 | 1.78 |
| 14.04.2024 | 1.81 | 2.23 | 1.41 |
| 13.04.2024 | 2.03 | 2.74 | 1.24 |
© Bayerisches Landesamt für Umwelt 2024