
- Start >
- Rivers >
- Discharge >
- Isar >
- Bad Aibling Willinger Brücke >
- Chart of total period

Chart of total period Bad Aibling Willinger Brücke / Mangfall
Discharge from 01.11.2009 to 24.04.2024
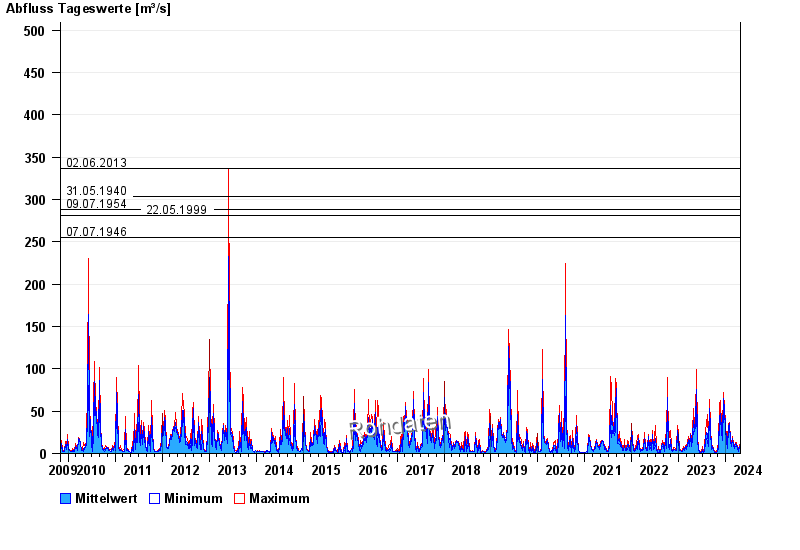
- 02.06.2013 Abfluss: 337 m³/s
- 31.05.1940 Abfluss: 304 m³/s
- 09.07.1954 Abfluss: 288 m³/s
- 22.05.1999 Abfluss: 281 m³/s
- 07.07.1946 Abfluss: 255 m³/s
| Date | Mean value [m³/s] | Maximum [m³/s] | Minimum [m³/s] |
|---|---|---|---|
| 24.04.2024 | 7.81 | 8.65 | 7.21 |
| 23.04.2024 | 8.14 | 9.16 | 7.21 |
| 22.04.2024 | 9.34 | 10.7 | 7.68 |
| 21.04.2024 | 8.65 | 10.7 | 7.21 |
| 20.04.2024 | 7.43 | 10.2 | 3.66 |
| 19.04.2024 | 2.45 | 3.66 | 1.83 |
| 18.04.2024 | 1.72 | 2.51 | 1.29 |
© Bayerisches Landesamt für Umwelt 2024