
- Start >
- Rivers >
- Discharge >
- Isar >
- Bad Aibling Q >
- Chart of year

Chart of year Bad Aibling Q / Triftbach
Discharge from 30.10.2020 to 29.10.2021
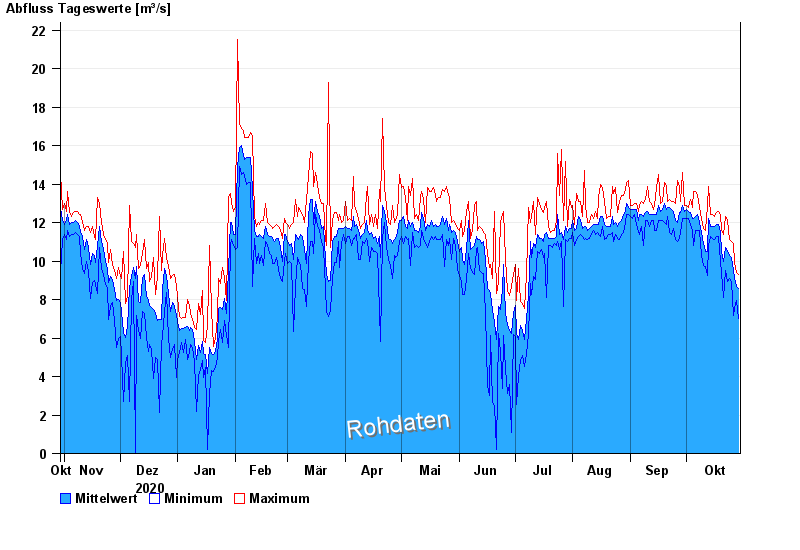
note
Schneefall kann die Messdaten verfälschen.
| Date | Mean value [m³/s] | Maximum [m³/s] | Minimum [m³/s] |
|---|---|---|---|
| 29.10.2021 | 8.55 | 9.29 | 7.03 |
| 28.10.2021 | 8.69 | 9.43 | 7.94 |
| 27.10.2021 | 9.08 | 9.95 | 7.56 |
| 26.10.2021 | 9.52 | 10.9 | 7.18 |
| 25.10.2021 | 10.2 | 11 | 8.94 |
| 24.10.2021 | 10.3 | 11.1 | 9.12 |
| 23.10.2021 | 10.5 | 12.1 | 8.94 |
© Bayerisches Landesamt für Umwelt 2024