
- Start >
- Rivers >
- Discharge >
- Isar >
- Bad Aibling Q >
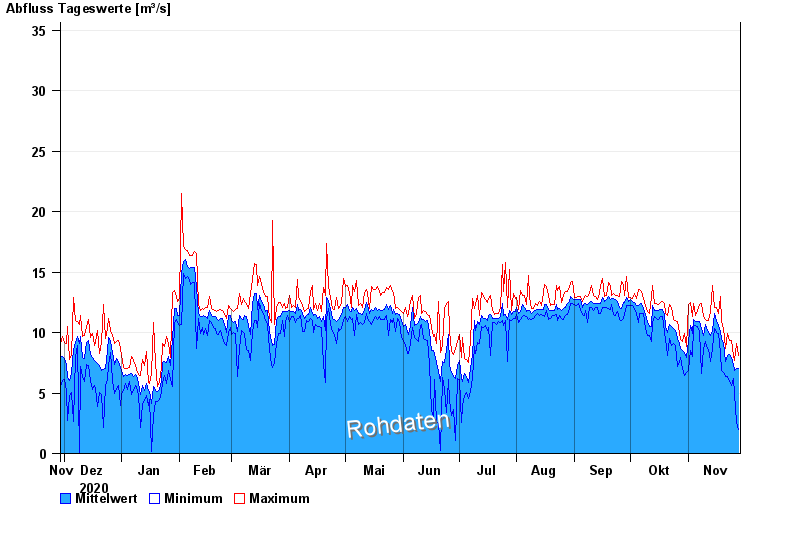
- Chart of year

Chart of year Bad Aibling Q / Triftbach
Discharge from 29.11.2020 to 28.11.2021
 Für diesen Pegel sind keine historische Ereignisse hinterlegt.
note
Schneefall kann die Messdaten verfälschen.
| Date | Mean value [m³/s] | Maximum [m³/s] | Minimum [m³/s] |
|---|---|---|---|
| 28.11.2021 | 7.01 | 8.13 | 1.99 |
| 27.11.2021 | 7 | 9.13 | 2.6 |
| 26.11.2021 | 6.85 | 7.69 | 4.96 |
| 25.11.2021 | 7.32 | 8.08 | 6.17 |
| 24.11.2021 | 7.94 | 9.33 | 5.61 |
| 23.11.2021 | 8.21 | 9.31 | 5.96 |
| 22.11.2021 | 8.13 | 9.96 | 6.38 |
© Bayerisches Landesamt für Umwelt 2024