
- Start >
- Rivers >
- Discharge >
- Isar >
- Bad Aibling >
- Chart of year

Chart of year Bad Aibling / Glonn
Discharge from 30.09.2023 to 29.09.2024
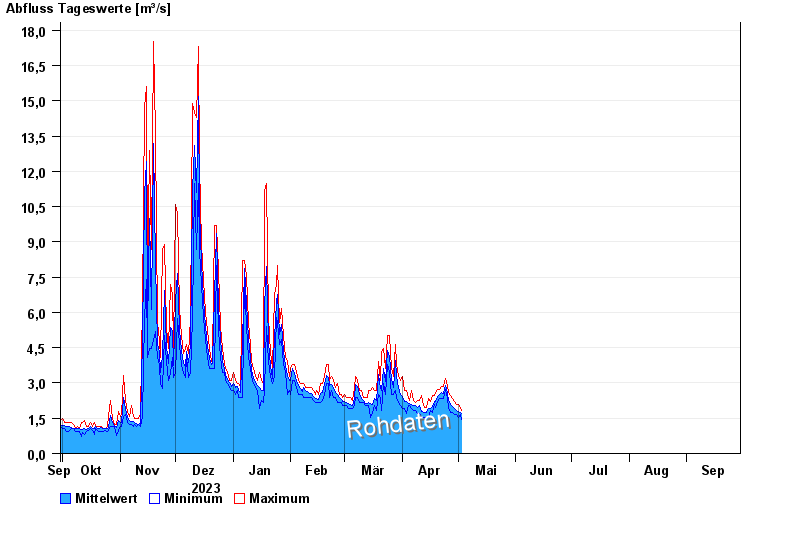
| Date | Mean value [m³/s] | Maximum [m³/s] | Minimum [m³/s] |
|---|---|---|---|
| 20.04.2024 | 2.4 | 2.58 | 2.19 |
| 19.04.2024 | 2.21 | 2.58 | 1.95 |
| 18.04.2024 | 2.22 | 2.45 | 2.07 |
| 17.04.2024 | 1.99 | 2.45 | 1.73 |
| 16.04.2024 | 1.93 | 2.19 | 1.84 |
| 15.04.2024 | 1.92 | 2.32 | 1.54 |
| 14.04.2024 | 1.74 | 1.95 | 1.54 |
© Bayerisches Landesamt für Umwelt 2024