
- Start >
- Rivers >
- Discharge >
- Isar >
- Bad Aibling >
- Chart of year

Chart of year Bad Aibling / Glonn
Discharge from 01.01.2023 to 31.12.2023
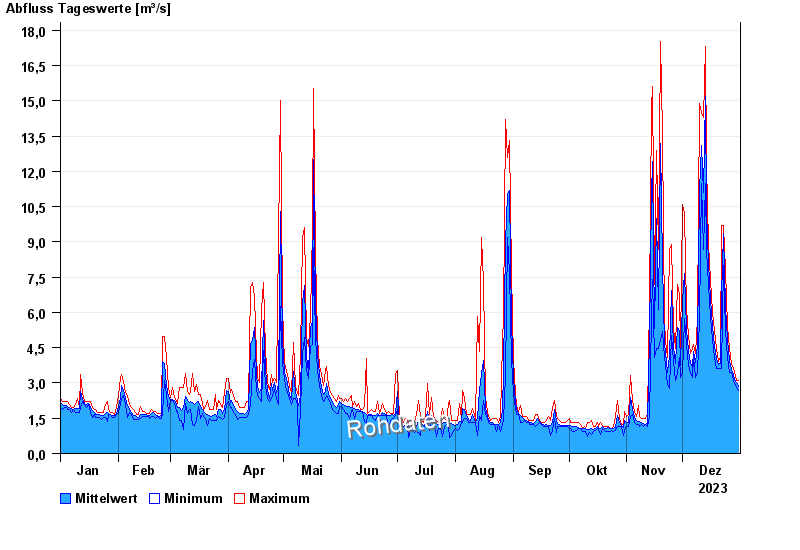
| Date | Mean value [m³/s] | Maximum [m³/s] | Minimum [m³/s] |
|---|---|---|---|
| 31.12.2023 | 2.87 | 3.11 | 2.67 |
| 30.12.2023 | 3 | 3.11 | 2.81 |
| 29.12.2023 | 3.16 | 3.43 | 2.96 |
| 28.12.2023 | 3.34 | 3.6 | 3.11 |
| 27.12.2023 | 3.59 | 3.77 | 3.43 |
| 26.12.2023 | 3.95 | 4.47 | 3.43 |
| 25.12.2023 | 4.83 | 5.4 | 4.1 |
© Bayerisches Landesamt für Umwelt 2024