
- Start >
- Rivers >
- Discharge >
- Isar >
- Au b. Bad Aibling >
- Chart of year

Chart of year Au b. Bad Aibling / Aubach
Discharge from 01.01.2020 to 31.12.2020
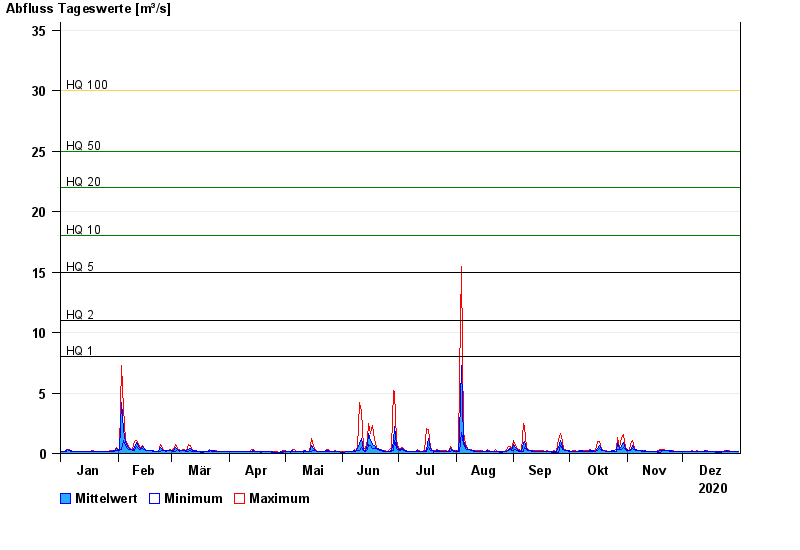
- HQ1 8 m³/s
- HQ2 11 m³/s
- HQ5 15 m³/s
- HQ10 18 m³/s
- HQ20 22 m³/s
- HQ50 25 m³/s
- HQ100 30 m³/s
| Date | Mean value [m³/s] | Maximum [m³/s] | Minimum [m³/s] |
|---|---|---|---|
| 31.12.2020 | 0.138 | 0.138 | 0.138 |
| 30.12.2020 | 0.141 | 0.162 | 0.138 |
| 29.12.2020 | 0.161 | 0.163 | 0.138 |
| 28.12.2020 | 0.167 | 0.19 | 0.163 |
| 27.12.2020 | 0.164 | 0.19 | 0.163 |
| 26.12.2020 | 0.191 | 0.22 | 0.163 |
| 25.12.2020 | 0.219 | 0.22 | 0.19 |
© Bayerisches Landesamt für Umwelt 2024