
- Start >
- Rivers >
- Discharge >
- Isar >
- Au b. Bad Aibling >
- Chart of year

Chart of year Au b. Bad Aibling / Aubach
Discharge from 07.08.2021 to 06.08.2022
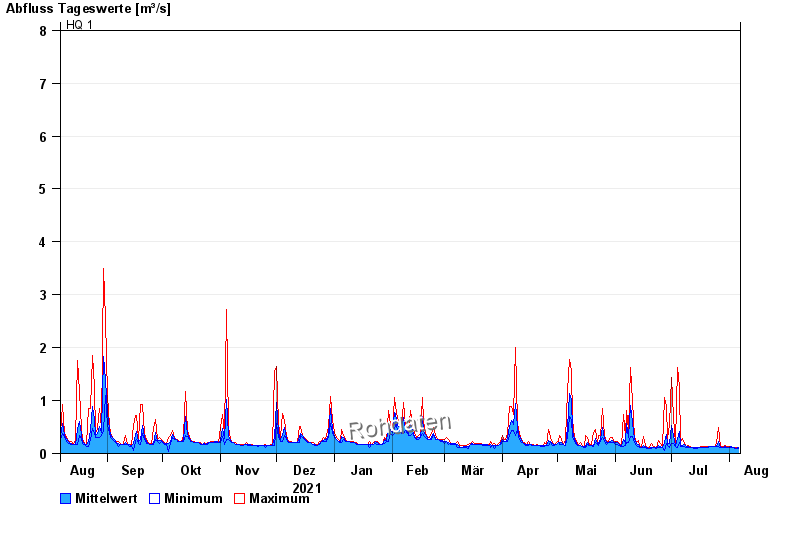
- HQ1 8 m³/s
- HQ2 11 m³/s
- HQ5 15 m³/s
- HQ10 18 m³/s
- HQ20 22 m³/s
- HQ50 25 m³/s
- HQ100 30 m³/s
| Date | Mean value [m³/s] | Maximum [m³/s] | Minimum [m³/s] |
|---|---|---|---|
| 06.08.2022 | 0.105 | 0.112 | 0.094 |
| 05.08.2022 | 0.094 | 0.112 | 0.094 |
| 04.08.2022 | 0.107 | 0.112 | 0.094 |
| 03.08.2022 | 0.112 | 0.112 | 0.112 |
| 02.08.2022 | 0.124 | 0.133 | 0.112 |
| 01.08.2022 | 0.117 | 0.133 | 0.112 |
| 31.07.2022 | 0.122 | 0.133 | 0.112 |
© Bayerisches Landesamt für Umwelt 2024