
- Start >
- Rivers >
- Discharge >
- Isar >
- Au b. Bad Aibling >
- Chart of total period

Chart of total period Au b. Bad Aibling / Aubach
Discharge from 01.11.1976 to 19.04.2024
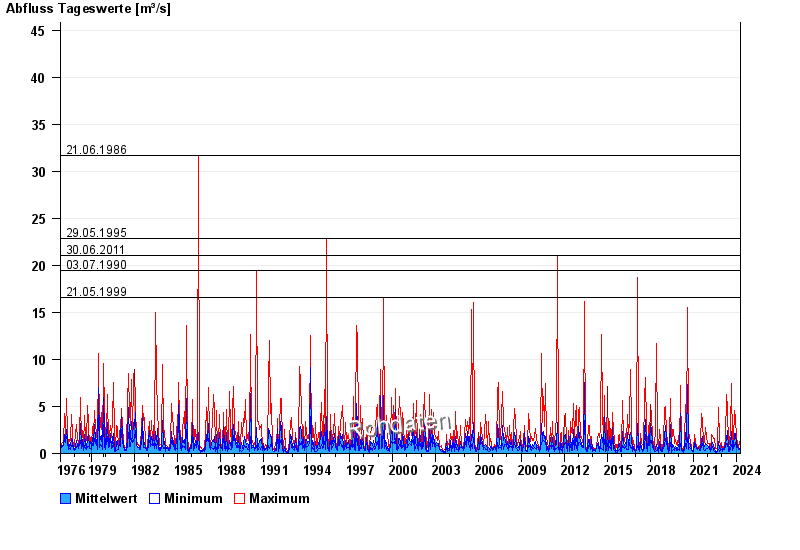
- 21.06.1986 Abfluss: 31,7 m³/s
- 29.05.1995 Abfluss: 22,9 m³/s
- 30.06.2011 Abfluss: 21 m³/s
- 03.07.1990 Abfluss: 19,5 m³/s
- 21.05.1999 Abfluss: 16,6 m³/s
| Date | Mean value [m³/s] | Maximum [m³/s] | Minimum [m³/s] |
|---|---|---|---|
| 19.04.2024 | 0.238 | 0.238 | 0.238 |
| 18.04.2024 | 0.238 | 0.273 | 0.238 |
| 17.04.2024 | 0.231 | 0.311 | 0.206 |
| 16.04.2024 | 0.206 | 0.238 | 0.206 |
| 15.04.2024 | 0.22 | 0.273 | 0.206 |
| 14.04.2024 | 0.206 | 0.206 | 0.206 |
| 13.04.2024 | 0.206 | 0.206 | 0.206 |
© Bayerisches Landesamt für Umwelt 2024