
- Start >
- Rivers >
- Discharge >
- Isar >
- Au b. Bad Aibling >
- Chart of total period

Chart of total period Au b. Bad Aibling / Aubach
Discharge from 01.11.1976 to 25.04.2024
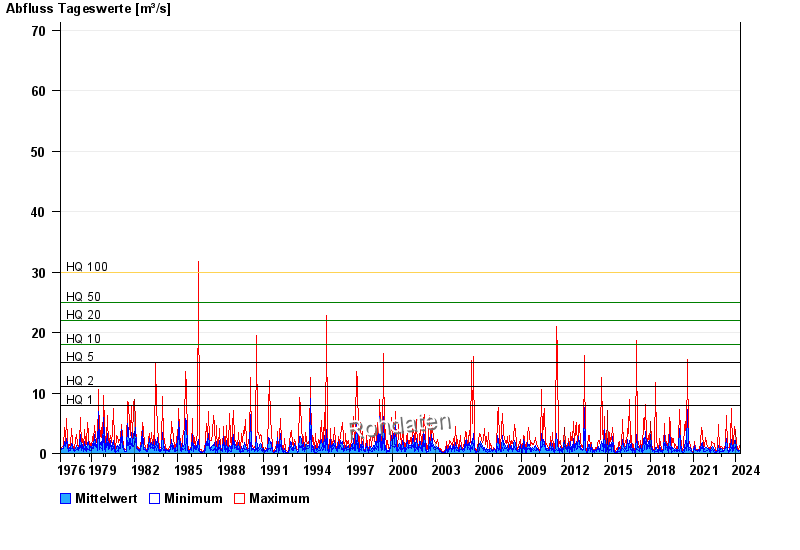
- HQ1 8 m³/s
- HQ2 11 m³/s
- HQ5 15 m³/s
- HQ10 18 m³/s
- HQ20 22 m³/s
- HQ50 25 m³/s
- HQ100 30 m³/s
| Date | Mean value [m³/s] | Maximum [m³/s] | Minimum [m³/s] |
|---|---|---|---|
| 25.04.2024 | 0.621 | 0.764 | 0.4 |
| 24.04.2024 | 0.729 | 0.914 | 0.629 |
| 23.04.2024 | 0.655 | 0.697 | 0.629 |
| 22.04.2024 | 0.593 | 0.629 | 0.566 |
| 21.04.2024 | 0.528 | 0.629 | 0.507 |
| 20.04.2024 | 0.489 | 0.629 | 0.4 |
| 19.04.2024 | 0.271 | 0.451 | 0.238 |
© Bayerisches Landesamt für Umwelt 2024