

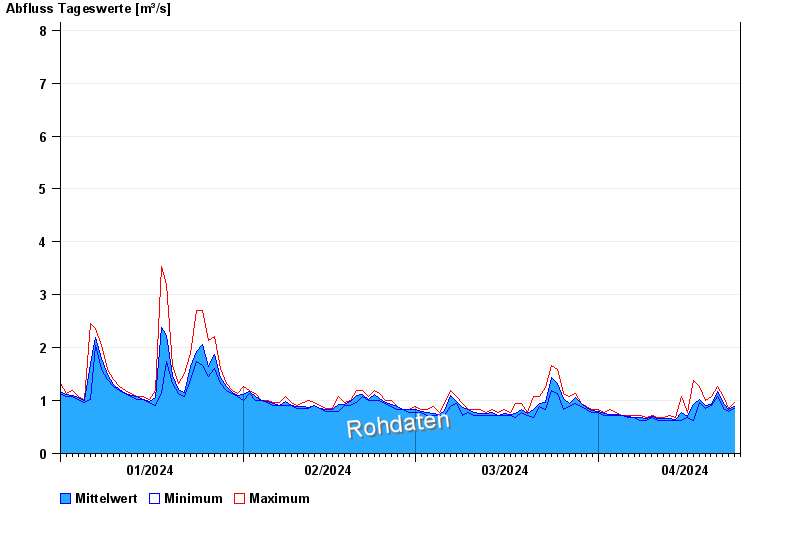
Chart of year Aßling / Attel
Discharge from 01.01.2024 to 24.04.2024
- HQ1 8,6 m³/s
- HQ2 10,9 m³/s
- HQ5 13,7 m³/s
- HQ10 15,8 m³/s
- HQ20 18 m³/s
- HQ50 21,4 m³/s
- HQ100 24,2 m³/s
| Date | Mean value [m³/s] | Maximum [m³/s] | Minimum [m³/s] |
|---|---|---|---|
| 24.04.2024 | 0.936 | 0.952 | 0.895 |
| 23.04.2024 | 0.882 | 0.895 | 0.838 |
| 22.04.2024 | 1 | 1.13 | 0.895 |
| 21.04.2024 | 1.23 | 1.31 | 1.13 |
| 20.04.2024 | 0.986 | 1.13 | 0.952 |
| 19.04.2024 | 0.964 | 1.07 | 0.895 |
| 18.04.2024 | 1.08 | 1.31 | 1.01 |
© Bayerisches Landesamt für Umwelt 2024