

Chart of total period Aßling / Attel
Discharge from 01.11.1958 to 25.04.2024
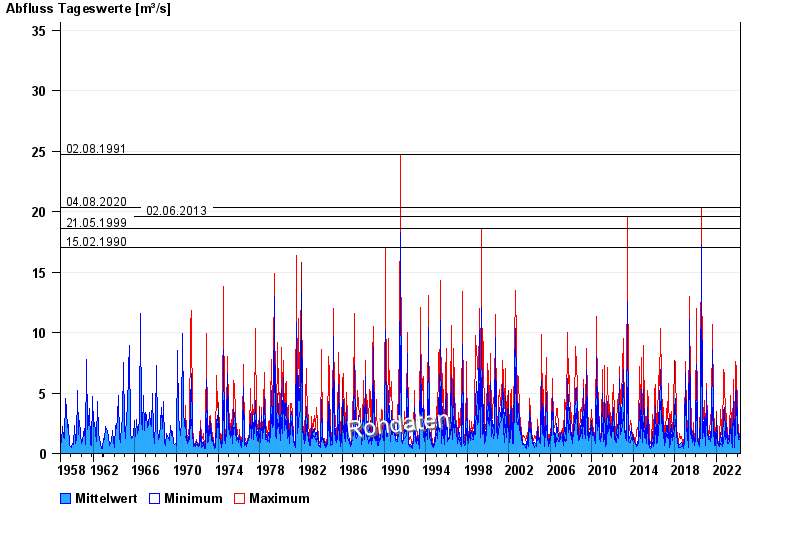
- 02.08.1991 Abfluss: 24,7 m³/s
- 04.08.2020 Abfluss: 20,3 m³/s
- 02.06.2013 Abfluss: 19,6 m³/s
- 21.05.1999 Abfluss: 18,6 m³/s
- 15.02.1990 Abfluss: 17 m³/s
| Date | Mean value [m³/s] | Maximum [m³/s] | Minimum [m³/s] |
|---|---|---|---|
| 25.04.2024 | 0.857 | 0.9 | 0.844 |
| 24.04.2024 | 0.888 | 0.957 | 0.844 |
| 23.04.2024 | 0.882 | 0.895 | 0.838 |
| 22.04.2024 | 1 | 1.13 | 0.895 |
| 21.04.2024 | 1.23 | 1.31 | 1.13 |
| 20.04.2024 | 0.986 | 1.13 | 0.952 |
| 19.04.2024 | 0.964 | 1.07 | 0.895 |
© Bayerisches Landesamt für Umwelt 2024