

Chart of total period Aßling / Attel
Discharge from 01.11.1958 to 18.04.2024
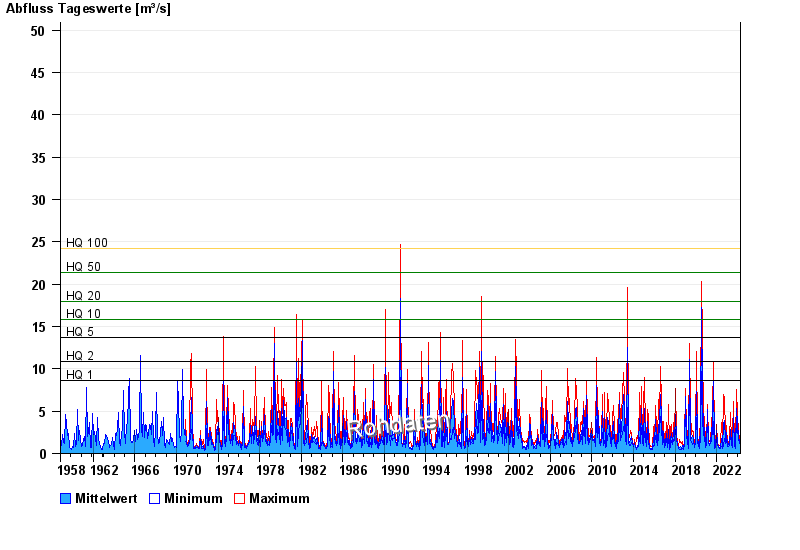
- HQ1 8,6 m³/s
- HQ2 10,9 m³/s
- HQ5 13,7 m³/s
- HQ10 15,8 m³/s
- HQ20 18 m³/s
- HQ50 21,4 m³/s
- HQ100 24,2 m³/s
| Date | Mean value [m³/s] | Maximum [m³/s] | Minimum [m³/s] |
|---|---|---|---|
| 18.04.2024 | 1.13 | 1.31 | 1.01 |
| 17.04.2024 | 0.924 | 1.38 | 0.619 |
| 16.04.2024 | 0.692 | 0.782 | 0.672 |
| 15.04.2024 | 0.767 | 1.07 | 0.619 |
| 14.04.2024 | 0.634 | 0.672 | 0.619 |
| 13.04.2024 | 0.659 | 0.726 | 0.619 |
| 12.04.2024 | 0.657 | 0.672 | 0.619 |
© Bayerisches Landesamt für Umwelt 2024