

Chart of year Anger / Attel
Discharge from 01.01.2019 to 31.12.2019
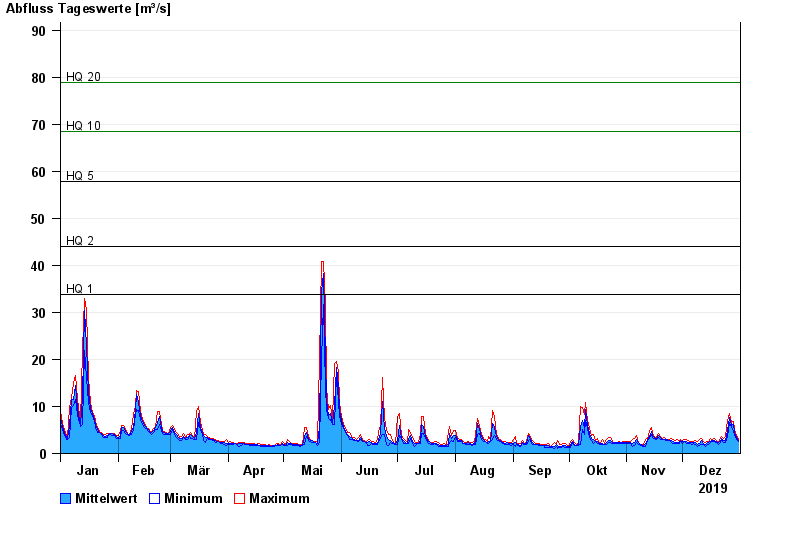
- HQ1 33,8 m³/s
- HQ2 44 m³/s
- HQ5 57,8 m³/s
- HQ10 68,4 m³/s
- HQ20 78,8 m³/s
- HQ50 93,4 m³/s
- HQ100 105 m³/s
| Date | Mean value [m³/s] | Maximum [m³/s] | Minimum [m³/s] |
|---|---|---|---|
| 31.12.2019 | 2.79 | 3.05 | 2.54 |
| 30.12.2019 | 3.36 | 3.82 | 3.04 |
| 29.12.2019 | 4.41 | 5.16 | 3.82 |
| 28.12.2019 | 6.17 | 6.83 | 4.88 |
| 27.12.2019 | 5.87 | 6.55 | 5.43 |
| 26.12.2019 | 7.72 | 8.57 | 6.55 |
| 25.12.2019 | 4.98 | 7.11 | 3.55 |
© Bayerisches Landesamt für Umwelt 2024