

Chart of year Anger / Attel
Discharge from 19.06.2019 to 18.06.2020
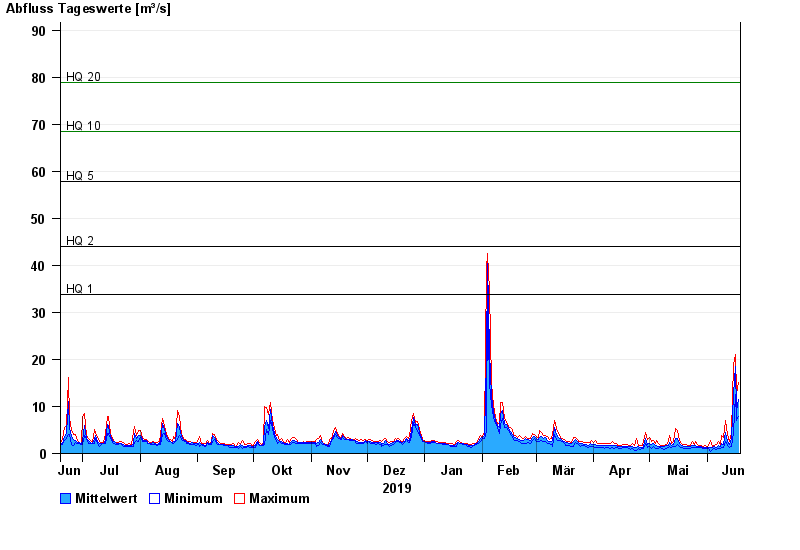
- HQ1 33,8 m³/s
- HQ2 44 m³/s
- HQ5 57,8 m³/s
- HQ10 68,4 m³/s
- HQ20 78,8 m³/s
- HQ50 93,4 m³/s
- HQ100 105 m³/s
| Date | Mean value [m³/s] | Maximum [m³/s] | Minimum [m³/s] |
|---|---|---|---|
| 18.06.2020 | 11.5 | 15 | 7.92 |
| 17.06.2020 | 8.9 | 12.5 | 7.05 |
| 16.06.2020 | 18.4 | 21 | 12.5 |
| 15.06.2020 | 12.7 | 18.9 | 4.54 |
| 14.06.2020 | 3.14 | 4.54 | 1.49 |
| 13.06.2020 | 1.97 | 2.47 | 1.27 |
| 12.06.2020 | 2.61 | 4.01 | 1.72 |
© Bayerisches Landesamt für Umwelt 2024