

Chart of year Anger / Attel
Discharge from 01.01.2018 to 31.12.2018
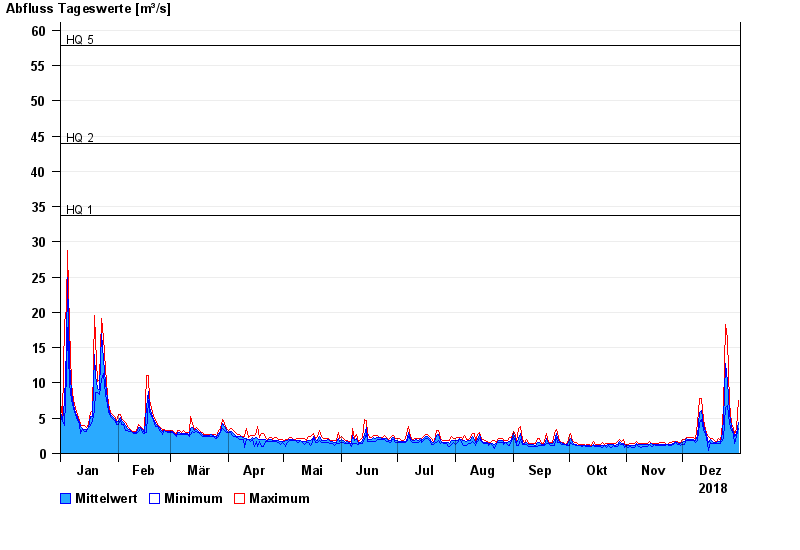
- HQ1 33,8 m³/s
- HQ2 44 m³/s
- HQ5 57,8 m³/s
- HQ10 68,4 m³/s
- HQ20 78,8 m³/s
- HQ50 93,4 m³/s
- HQ100 105 m³/s
| Date | Mean value [m³/s] | Maximum [m³/s] | Minimum [m³/s] |
|---|---|---|---|
| 31.12.2018 | 4.37 | 7.58 | 3.53 |
| 30.12.2018 | 2.85 | 3.53 | 2.46 |
| 29.12.2018 | 2.43 | 2.72 | 1.44 |
| 28.12.2018 | 2.93 | 3.51 | 2.72 |
| 27.12.2018 | 3.83 | 4.32 | 3.25 |
| 26.12.2018 | 5.65 | 7.09 | 4.31 |
| 25.12.2018 | 10.2 | 16.3 | 6.84 |
© Bayerisches Landesamt für Umwelt 2024