

Chart of total period Ammerberg / Sur
Discharge from 07.07.1997 to 23.04.2024
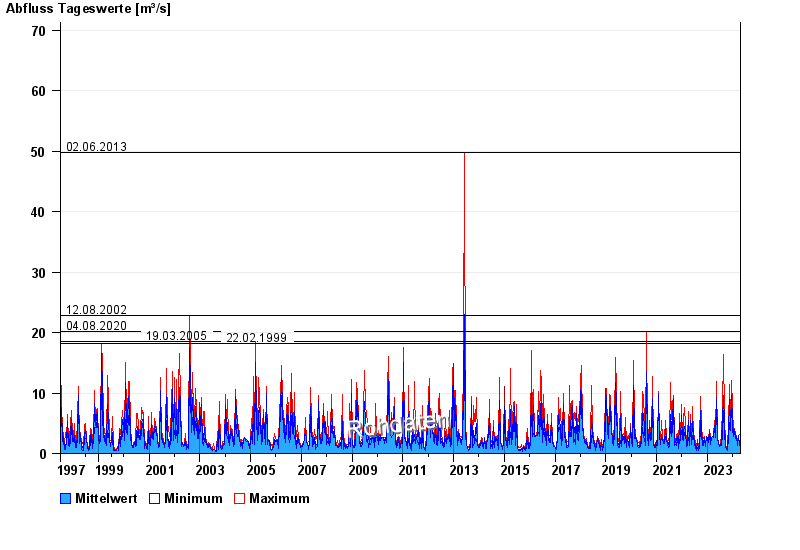
- 02.06.2013 Abfluss: 49,7 m³/s
- 12.08.2002 Abfluss: 22,8 m³/s
- 04.08.2020 Abfluss: 20,1 m³/s
- 19.03.2005 Abfluss: 18,5 m³/s
- 22.02.1999 Abfluss: 18,2 m³/s
| Date | Mean value [m³/s] | Maximum [m³/s] | Minimum [m³/s] |
|---|---|---|---|
| 23.04.2024 | 2.99 | 3 | 2.83 |
| 22.04.2024 | 3 | 3 | 3 |
| 21.04.2024 | 3 | 3 | 2.83 |
| 20.04.2024 | 2.87 | 3 | 2.66 |
| 19.04.2024 | 1.48 | 2.66 | 1.26 |
| 18.04.2024 | 1.47 | 1.74 | 1.36 |
| 17.04.2024 | 1.29 | 1.74 | 0.963 |
© Bayerisches Landesamt für Umwelt 2024