

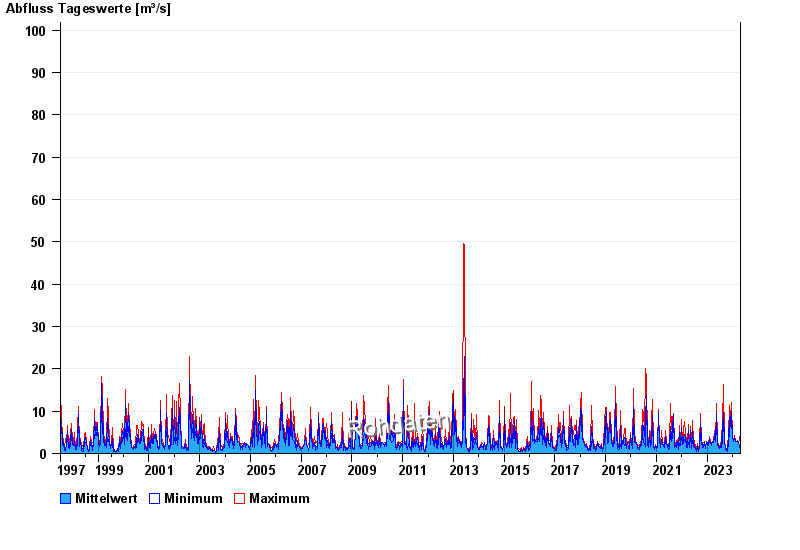
Chart of total period Ammerberg / Sur
Discharge from 07.07.1997 to 25.04.2024
 Für diesen Pegel sind keine Jährlichkeiten hinterlegt.
| Date | Mean value [m³/s] | Maximum [m³/s] | Minimum [m³/s] |
|---|---|---|---|
| 25.04.2024 | 2.53 | 2.66 | 2.5 |
| 24.04.2024 | 2.82 | 2.83 | 2.66 |
| 23.04.2024 | 2.96 | 3 | 2.83 |
| 22.04.2024 | 3 | 3 | 3 |
| 21.04.2024 | 3 | 3 | 2.83 |
| 20.04.2024 | 2.87 | 3 | 2.66 |
| 19.04.2024 | 1.48 | 2.66 | 1.26 |
© Bayerisches Landesamt für Umwelt 2024