

Chart of year Altenfurt / Weilach
Discharge from 01.01.2024 to 20.04.2024
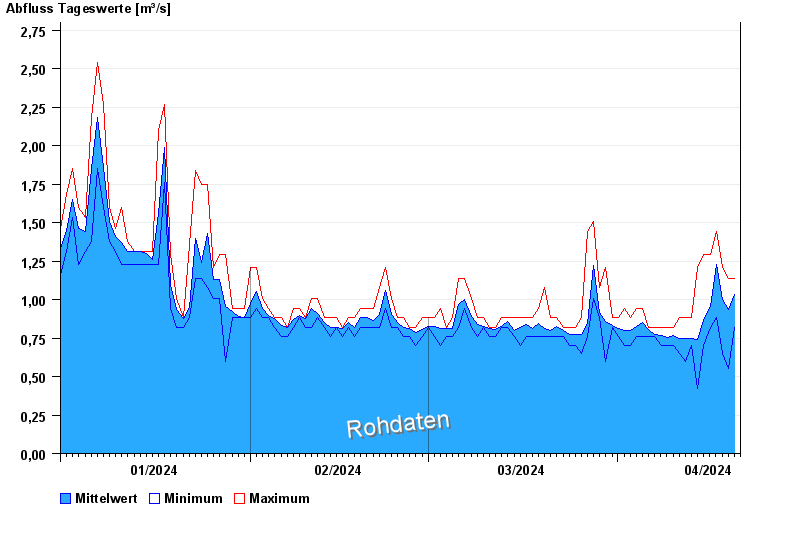
| Date | Mean value [m³/s] | Maximum [m³/s] | Minimum [m³/s] |
|---|---|---|---|
| 20.04.2024 | 1.07 | 1.08 | 1.01 |
| 19.04.2024 | 0.933 | 1.14 | 0.551 |
| 18.04.2024 | 0.999 | 1.21 | 0.65 |
| 17.04.2024 | 1.23 | 1.44 | 0.881 |
| 16.04.2024 | 0.954 | 1.29 | 0.818 |
| 15.04.2024 | 0.863 | 1.29 | 0.704 |
| 14.04.2024 | 0.74 | 1.21 | 0.423 |
© Bayerisches Landesamt für Umwelt 2024