

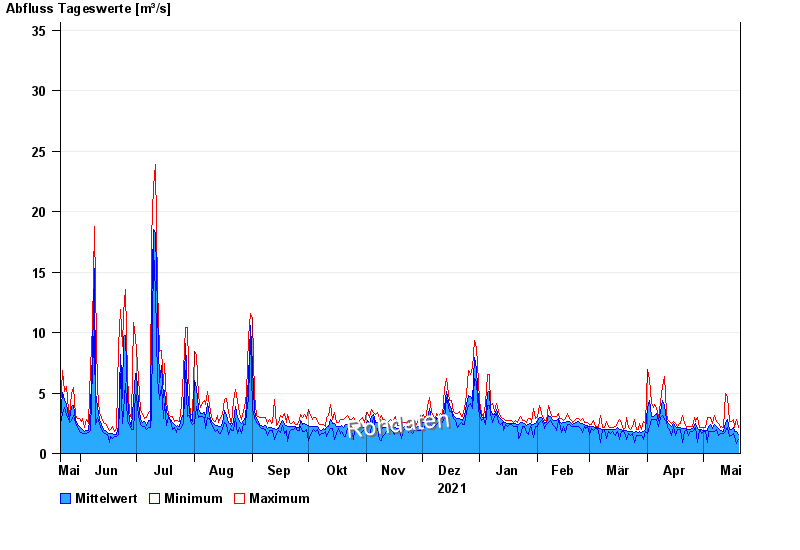
Chart of year Achsheim / Schmutter
Discharge from 21.05.2021 to 20.05.2022
- 23.08.2005 Abfluss: 100 m³/s
- 14.04.1994 Abfluss: 64 m³/s
- 22.09.2000 Abfluss: 60,8 m³/s
- 12.08.2002 Abfluss: 60,3 m³/s
- 08.06.2002 Abfluss: 59,2 m³/s
| Date | Mean value [m³/s] | Maximum [m³/s] | Minimum [m³/s] |
|---|---|---|---|
| 20.05.2022 | 1.58 | 2.11 | 1.15 |
| 19.05.2022 | 1.83 | 2.8 | 0.834 |
| 18.05.2022 | 1.79 | 2.11 | 1.4 |
| 17.05.2022 | 2.11 | 2.8 | 1.66 |
| 16.05.2022 | 1.97 | 2.61 | 1.52 |
| 15.05.2022 | 1.97 | 2.61 | 1.4 |
| 14.05.2022 | 2.81 | 4.73 | 2.11 |
© Bayerisches Landesamt für Umwelt 2024