

Chart of year Achsheim / Schmutter
Discharge from 21.09.2021 to 20.09.2022
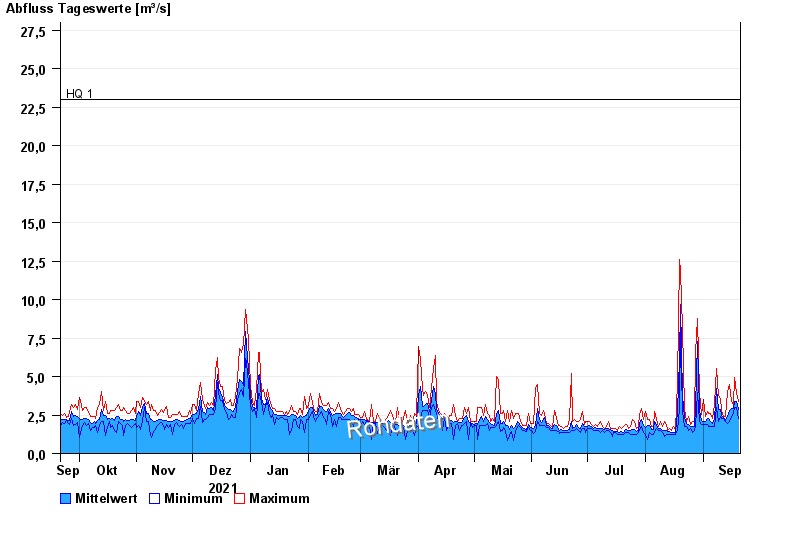
- HQ1 23 m³/s
- HQ2 30 m³/s
- HQ5 43 m³/s
- HQ10 53 m³/s
- HQ20 62 m³/s
- HQ50 77 m³/s
- HQ100 88 m³/s
| Date | Mean value [m³/s] | Maximum [m³/s] | Minimum [m³/s] |
|---|---|---|---|
| 20.09.2022 | 2.86 | 3.36 | 2.25 |
| 19.09.2022 | 3.37 | 3.99 | 2.97 |
| 18.09.2022 | 3.39 | 4.95 | 2.97 |
| 17.09.2022 | 2.95 | 3.16 | 2.59 |
| 16.09.2022 | 2.91 | 3.36 | 2.42 |
| 15.09.2022 | 2.82 | 4.46 | 2.09 |
| 14.09.2022 | 2.42 | 3.99 | 1.94 |
© Bayerisches Landesamt für Umwelt 2024