
- Start >
- Rivers >
- Discharge >
- Inn >
- Weichselbaum >
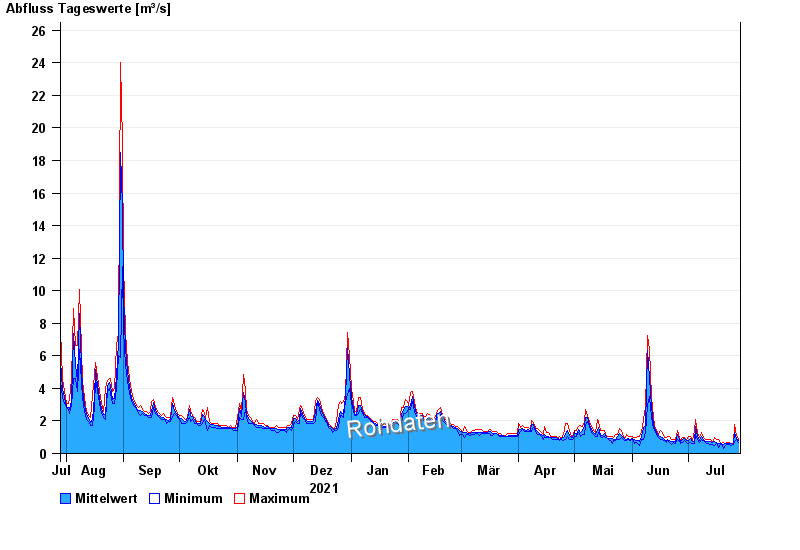
- Chart of year

Chart of year Weichselbaum / Murn
Discharge from 29.07.2021 to 28.07.2022
| Date | Mean value [m³/s] | Maximum [m³/s] | Minimum [m³/s] |
|---|---|---|---|
| 28.07.2022 | 0.795 | 0.832 | 0.679 |
| 27.07.2022 | 0.947 | 1.1 | 0.832 |
| 26.07.2022 | 1.28 | 1.78 | 0.752 |
| 25.07.2022 | 0.571 | 0.631 | 0.562 |
| 24.07.2022 | 0.595 | 0.631 | 0.5 |
| 23.07.2022 | 0.617 | 0.705 | 0.562 |
| 22.07.2022 | 0.613 | 0.705 | 0.562 |
© Bayerisches Landesamt für Umwelt 2024