
- Start >
- Rivers >
- Discharge >
- Inn >
- Weichselbaum >
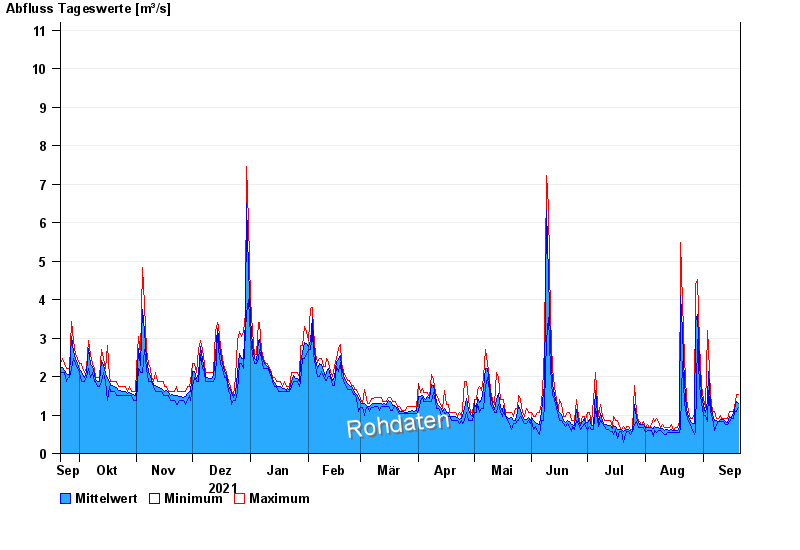
- Chart of year

Chart of year Weichselbaum / Murn
Discharge from 21.09.2021 to 20.09.2022
- 02.06.2013 Abfluss: 71,5 m³/s
- 02.08.1991 Abfluss: 41,7 m³/s
- 03.06.2010 Abfluss: 39,8 m³/s
- 21.05.1999 Abfluss: 39,8 m³/s
- 02.06.1995 Abfluss: 37,1 m³/s
| Date | Mean value [m³/s] | Maximum [m³/s] | Minimum [m³/s] |
|---|---|---|---|
| 20.09.2022 | 1.3 | 1.53 | 1.19 |
| 19.09.2022 | 1.35 | 1.53 | 1.09 |
| 18.09.2022 | 1.14 | 1.19 | 1.09 |
| 17.09.2022 | 1.04 | 1.09 | 0.905 |
| 16.09.2022 | 0.947 | 1.09 | 0.905 |
| 15.09.2022 | 0.957 | 1.09 | 0.821 |
| 14.09.2022 | 0.816 | 0.905 | 0.741 |
© Bayerisches Landesamt für Umwelt 2024