
- Start >
- Rivers >
- Discharge >
- Inn >
- Weichselbaum >
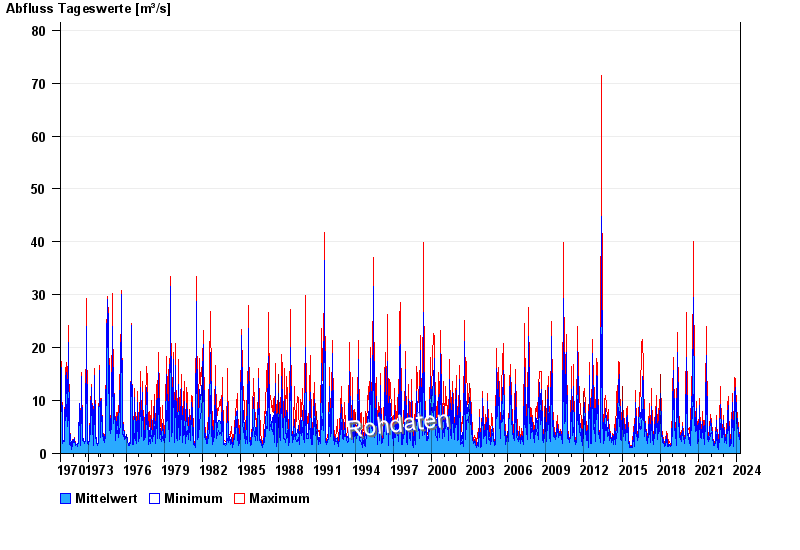
- Chart of total period

Chart of total period Weichselbaum / Murn
Discharge from 01.11.1970 to 25.04.2024
| Date | Mean value [m³/s] | Maximum [m³/s] | Minimum [m³/s] |
|---|---|---|---|
| 25.04.2024 | 3.11 | 3.24 | 2.95 |
| 24.04.2024 | 3.35 | 3.39 | 3.24 |
| 23.04.2024 | 3.27 | 3.71 | 2.98 |
| 22.04.2024 | 4.22 | 4.56 | 3.71 |
| 21.04.2024 | 3.59 | 4.56 | 3.12 |
| 20.04.2024 | 2.87 | 3.12 | 2.69 |
| 19.04.2024 | 2.73 | 2.98 | 2.54 |
© Bayerisches Landesamt für Umwelt 2024