

Chart of year Weg / Isen
Discharge from 21.08.2019 to 20.08.2020
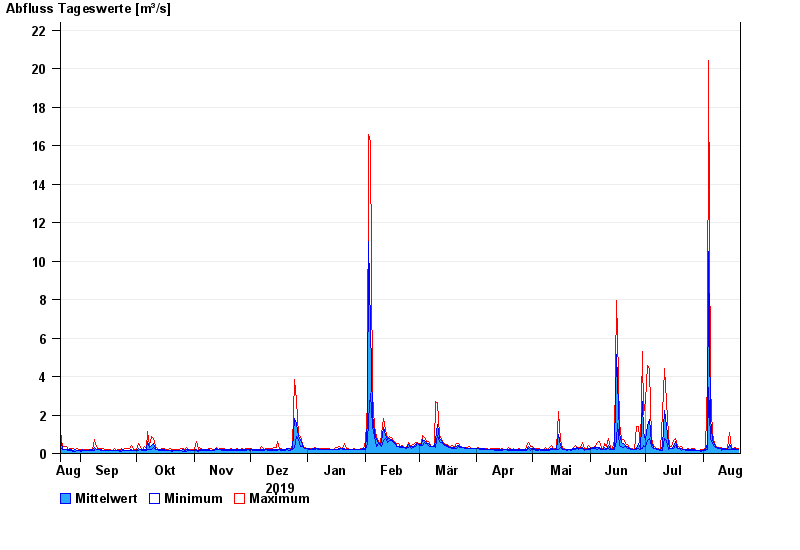
| Date | Mean value [m³/s] | Maximum [m³/s] | Minimum [m³/s] |
|---|---|---|---|
| 20.08.2020 | 0.213 | 0.237 | 0.192 |
| 19.08.2020 | 0.233 | 0.255 | 0.206 |
| 18.08.2020 | 0.244 | 0.288 | 0.219 |
| 17.08.2020 | 0.237 | 0.259 | 0.215 |
| 16.08.2020 | 0.269 | 0.307 | 0.233 |
| 15.08.2020 | 0.443 | 1.08 | 0.226 |
| 14.08.2020 | 0.226 | 0.24 | 0.216 |
© Bayerisches Landesamt für Umwelt 2024