

Chart of year Weg / Isen
Discharge from 20.09.2019 to 19.09.2020
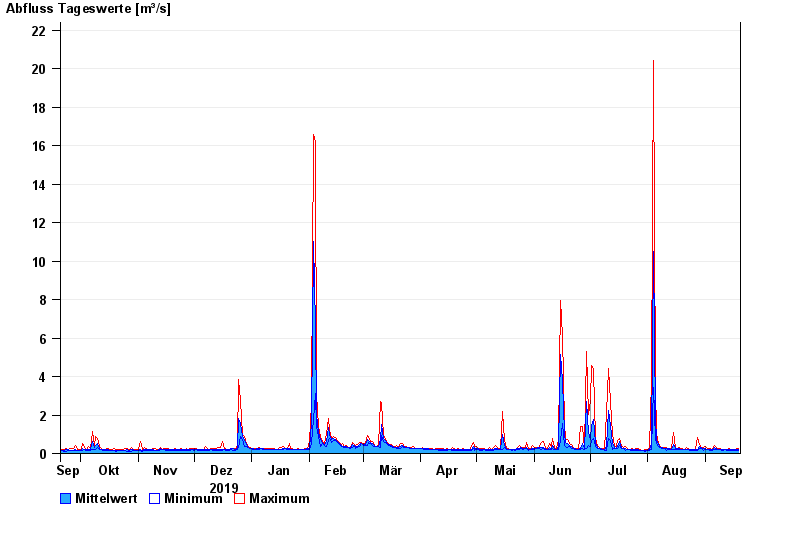
| Date | Mean value [m³/s] | Maximum [m³/s] | Minimum [m³/s] |
|---|---|---|---|
| 19.09.2020 | 0.191 | 0.255 | 0.166 |
| 18.09.2020 | 0.185 | 0.24 | 0.166 |
| 17.09.2020 | 0.187 | 0.206 | 0.172 |
| 16.09.2020 | 0.187 | 0.205 | 0.172 |
| 15.09.2020 | 0.189 | 0.212 | 0.159 |
| 14.09.2020 | 0.192 | 0.257 | 0.159 |
| 13.09.2020 | 0.195 | 0.222 | 0.175 |
© Bayerisches Landesamt für Umwelt 2024