

Chart of year Weg / Isen
Discharge from 01.01.2024 to 23.04.2024
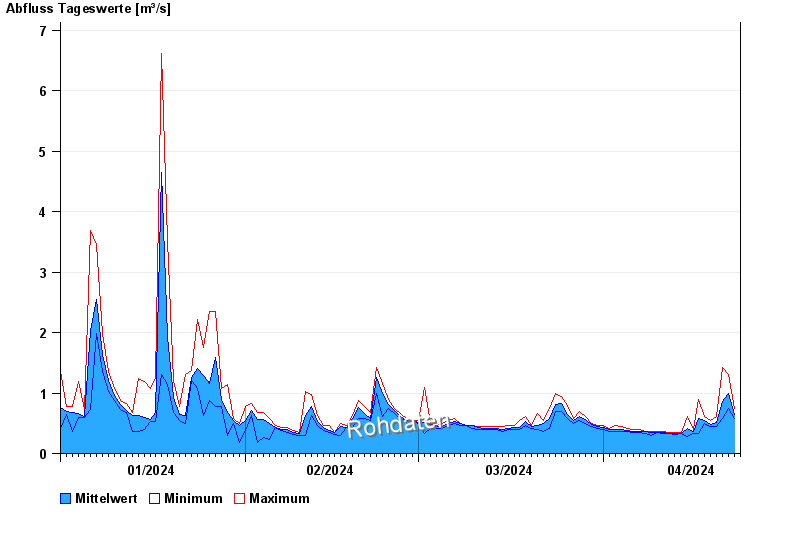
| Date | Mean value [m³/s] | Maximum [m³/s] | Minimum [m³/s] |
|---|---|---|---|
| 23.04.2024 | 0.67 | 0.742 | 0.615 |
| 22.04.2024 | 0.993 | 1.31 | 0.742 |
| 21.04.2024 | 0.855 | 1.43 | 0.576 |
| 20.04.2024 | 0.506 | 0.615 | 0.441 |
| 19.04.2024 | 0.481 | 0.539 | 0.441 |
| 18.04.2024 | 0.539 | 0.615 | 0.503 |
| 17.04.2024 | 0.583 | 0.886 | 0.334 |
© Bayerisches Landesamt für Umwelt 2024