

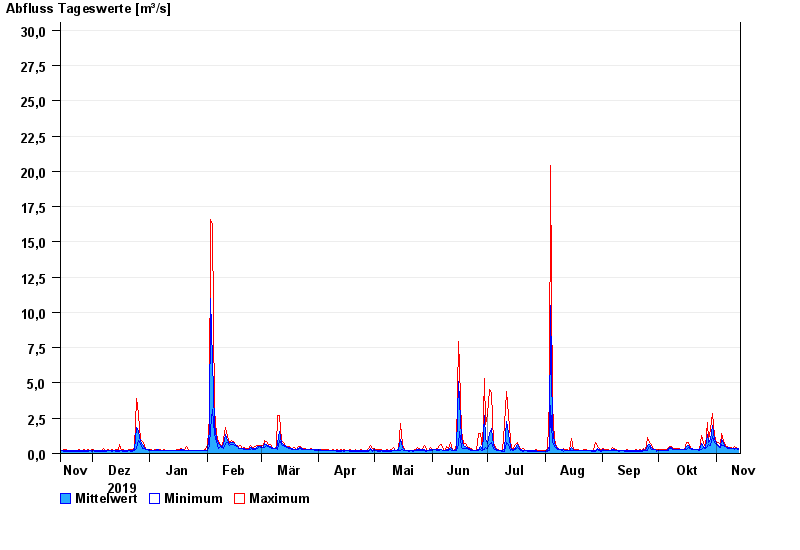
Chart of year Weg / Isen
Discharge from 14.11.2019 to 13.11.2020
- 01.08.1991 Abfluss: 52,8 m³/s
- 04.08.1973 Abfluss: 47,2 m³/s
- 15.02.1990 Abfluss: 45,3 m³/s
- 03.08.1987 Abfluss: 42,6 m³/s
- 02.06.1995 Abfluss: 41,4 m³/s
| Date | Mean value [m³/s] | Maximum [m³/s] | Minimum [m³/s] |
|---|---|---|---|
| 13.11.2020 | 0.326 | 0.346 | 0.309 |
| 12.11.2020 | 0.339 | 0.407 | 0.319 |
| 11.11.2020 | 0.34 | 0.467 | 0.311 |
| 10.11.2020 | 0.342 | 0.374 | 0.323 |
| 09.11.2020 | 0.362 | 0.393 | 0.342 |
| 08.11.2020 | 0.394 | 0.442 | 0.359 |
| 07.11.2020 | 0.435 | 0.519 | 0.369 |
© Bayerisches Landesamt für Umwelt 2024