

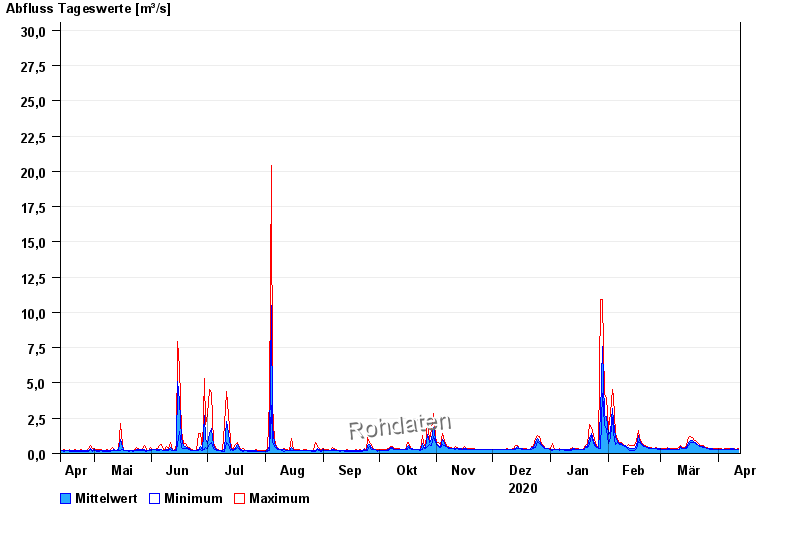
Chart of year Weg / Isen
Discharge from 13.04.2020 to 12.04.2021
- 01.08.1991 Abfluss: 52,8 m³/s
- 04.08.1973 Abfluss: 47,2 m³/s
- 15.02.1990 Abfluss: 45,3 m³/s
- 03.08.1987 Abfluss: 42,6 m³/s
- 02.06.1995 Abfluss: 41,4 m³/s
| Date | Mean value [m³/s] | Maximum [m³/s] | Minimum [m³/s] |
|---|---|---|---|
| 12.04.2021 | 0.309 | 0.341 | 0.279 |
| 11.04.2021 | 0.292 | 0.31 | 0.263 |
| 10.04.2021 | 0.31 | 0.341 | 0.279 |
| 09.04.2021 | 0.334 | 0.377 | 0.31 |
| 08.04.2021 | 0.336 | 0.377 | 0.294 |
| 07.04.2021 | 0.31 | 0.341 | 0.279 |
| 06.04.2021 | 0.308 | 0.358 | 0.279 |
© Bayerisches Landesamt für Umwelt 2024