

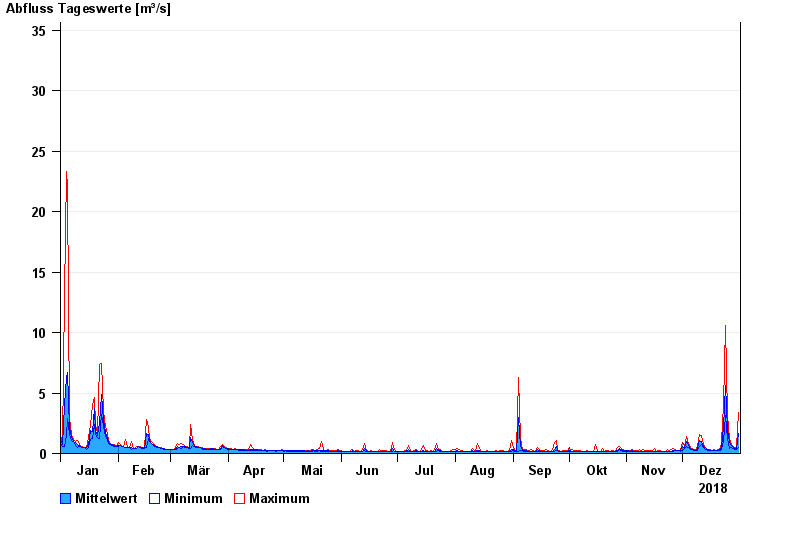
Chart of year Weg / Isen
Discharge from 01.01.2018 to 31.12.2018
- 01.08.1991 Abfluss: 52,8 m³/s
- 04.08.1973 Abfluss: 47,2 m³/s
- 15.02.1990 Abfluss: 45,3 m³/s
- 03.08.1987 Abfluss: 42,6 m³/s
- 02.06.1995 Abfluss: 41,4 m³/s
| Date | Mean value [m³/s] | Maximum [m³/s] | Minimum [m³/s] |
|---|---|---|---|
| 31.12.2018 | 1.63 | 3.43 | 0.461 |
| 30.12.2018 | 0.443 | 0.548 | 0.322 |
| 29.12.2018 | 0.37 | 0.425 | 0.322 |
| 28.12.2018 | 0.465 | 0.62 | 0.374 |
| 27.12.2018 | 0.63 | 0.782 | 0.485 |
| 26.12.2018 | 0.924 | 1.28 | 0.391 |
| 25.12.2018 | 1.95 | 3.12 | 1.28 |
© Bayerisches Landesamt für Umwelt 2024