

Chart of year Valley / Mangfall
Discharge from 01.01.2024 to 18.04.2024
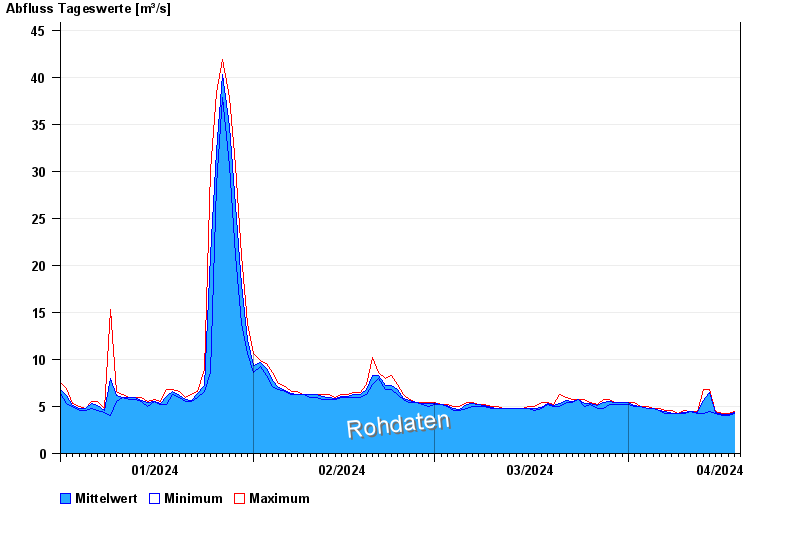
| Date | Mean value [m³/s] | Maximum [m³/s] | Minimum [m³/s] |
|---|---|---|---|
| 18.04.2024 | 4.28 | 4.5 | 4.27 |
| 17.04.2024 | 4.13 | 4.27 | 4.06 |
| 16.04.2024 | 4.17 | 4.3 | 4.09 |
| 15.04.2024 | 4.33 | 4.52 | 4.3 |
| 14.04.2024 | 6.51 | 6.79 | 4.52 |
| 13.04.2024 | 5.67 | 6.79 | 4.3 |
| 12.04.2024 | 4.43 | 4.52 | 4.3 |
© Bayerisches Landesamt für Umwelt 2024