

Chart of total period Valley / Mangfall
Discharge from 04.11.1939 to 16.04.2024
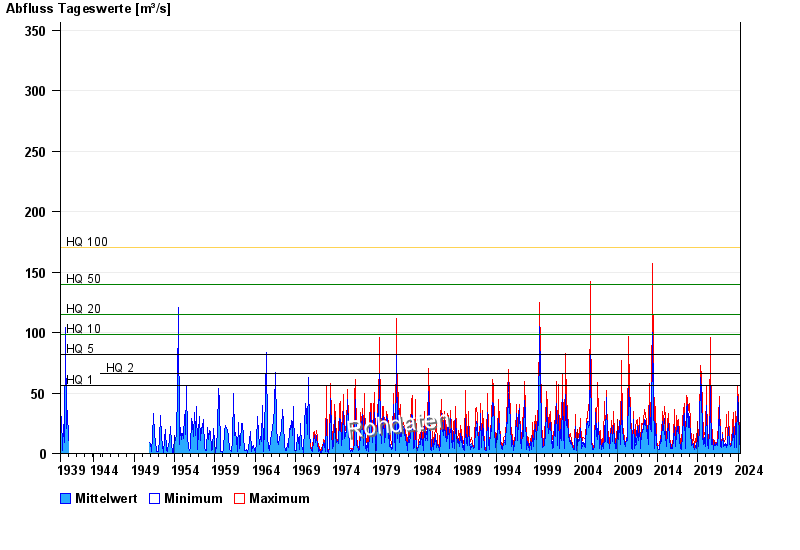
- HQ1 56 m³/s
- HQ2 66 m³/s
- HQ5 82 m³/s
- HQ10 98 m³/s
- HQ20 115 m³/s
- HQ50 140 m³/s
- HQ100 170 m³/s
| Date | Mean value [m³/s] | Maximum [m³/s] | Minimum [m³/s] |
|---|---|---|---|
| 16.04.2024 | 4.18 | 4.3 | 4.09 |
| 15.04.2024 | 4.33 | 4.52 | 4.3 |
| 14.04.2024 | 6.51 | 6.79 | 4.52 |
| 13.04.2024 | 5.67 | 6.79 | 4.3 |
| 12.04.2024 | 4.43 | 4.52 | 4.3 |
| 11.04.2024 | 4.52 | 4.52 | 4.52 |
| 10.04.2024 | 4.41 | 4.52 | 4.3 |
© Bayerisches Landesamt für Umwelt 2024