

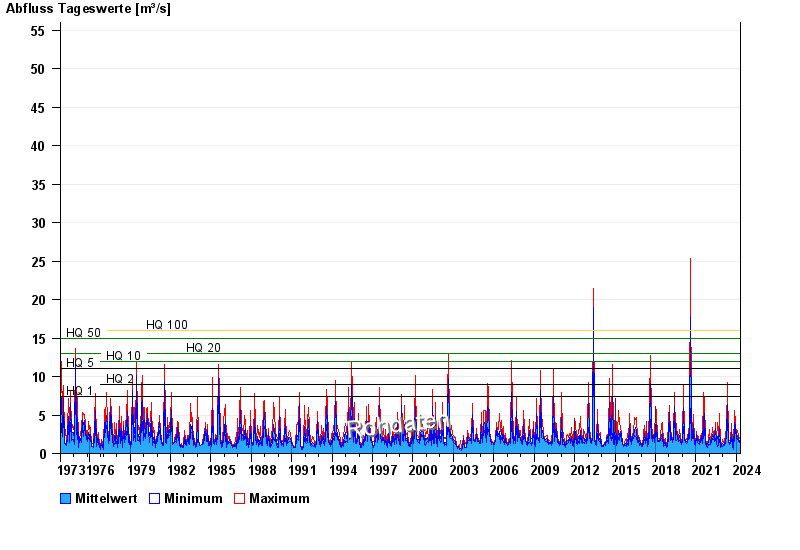
Chart of total period Übersee / Überseer Bach
Discharge from 01.11.1973 to 25.04.2024
note
Datenabruf nur 07:00, 15:00 und 23:00 MEZ
- HQ1 7,4 m³/s
- HQ2 9 m³/s
- HQ5 11 m³/s
- HQ10 12 m³/s
- HQ20 13 m³/s
- HQ50 15 m³/s
- HQ100 16 m³/s
| Date | Mean value [m³/s] | Maximum [m³/s] | Minimum [m³/s] |
|---|---|---|---|
| 25.04.2024 | 1.42 | 1.43 | 1.36 |
| 24.04.2024 | 1.46 | 1.5 | 1.43 |
| 23.04.2024 | 1.45 | 1.5 | 1.43 |
| 22.04.2024 | 1.59 | 1.71 | 1.5 |
| 21.04.2024 | 1.8 | 1.94 | 1.71 |
| 20.04.2024 | 1.75 | 2.02 | 1.63 |
| 19.04.2024 | 1.37 | 1.63 | 1.12 |
© Bayerisches Landesamt für Umwelt 2024