

Chart of year Trostberg / Alz
Discharge from 13.08.2020 to 12.08.2021
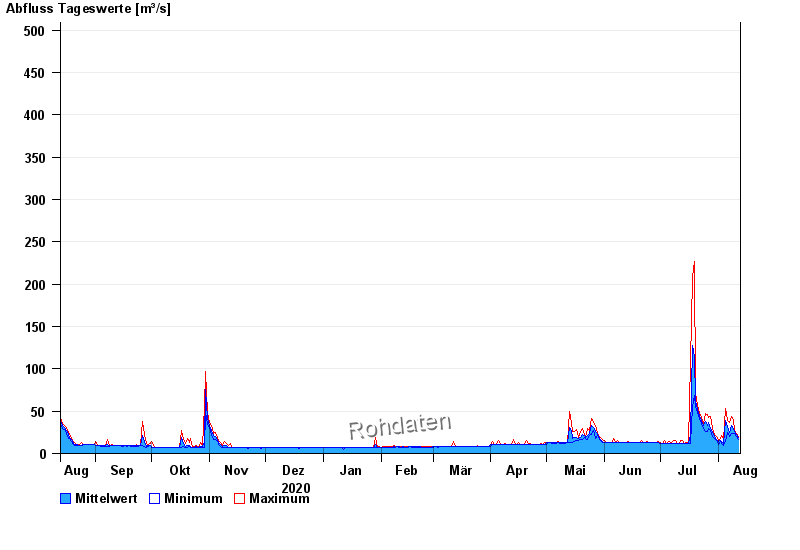 Für diesen Pegel sind keine Jährlichkeiten hinterlegt.
| Date | Mean value [m³/s] | Maximum [m³/s] | Minimum [m³/s] |
|---|---|---|---|
| 12.08.2021 | 18.6 | 20.1 | 16.8 |
| 11.08.2021 | 22.1 | 23.6 | 20.1 |
| 10.08.2021 | 25.5 | 27.4 | 23.6 |
| 09.08.2021 | 30 | 38.7 | 23.6 |
| 08.08.2021 | 32.8 | 43.2 | 24.2 |
| 07.08.2021 | 24.8 | 36.5 | 19.5 |
| 06.08.2021 | 32 | 38.7 | 24.8 |
© Bayerisches Landesamt für Umwelt 2024