

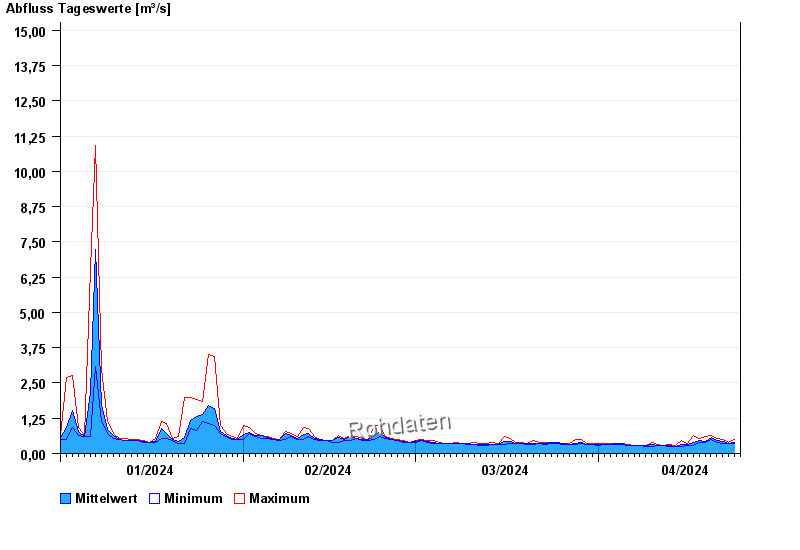
Chart of year Triftern / Altbach
Discharge from 01.01.2024 to 24.04.2024
- 01.08.1991 Abfluss: 67,9 m³/s
- 01.07.1987 Abfluss: 55,8 m³/s
- 01.08.1991 Abfluss: 45,5 m³/s
- 12.06.1990 Abfluss: 44,2 m³/s
- 10.07.1999 Abfluss: 37,8 m³/s
| Date | Mean value [m³/s] | Maximum [m³/s] | Minimum [m³/s] |
|---|---|---|---|
| 24.04.2024 | 0.37 | 0.401 | 0.358 |
| 23.04.2024 | 0.358 | 0.401 | 0.358 |
| 22.04.2024 | 0.41 | 0.496 | 0.358 |
| 21.04.2024 | 0.457 | 0.546 | 0.401 |
| 20.04.2024 | 0.559 | 0.652 | 0.496 |
| 19.04.2024 | 0.432 | 0.599 | 0.401 |
| 18.04.2024 | 0.465 | 0.546 | 0.401 |
© Bayerisches Landesamt für Umwelt 2024