

Chart of year Triftern / Altbach
Discharge from 10.02.2023 to 09.02.2024
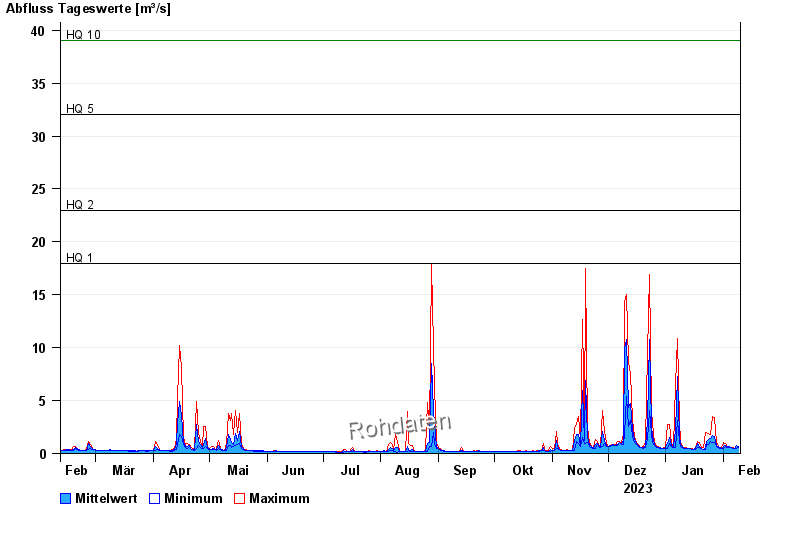
- HQ1 18 m³/s
- HQ2 23 m³/s
- HQ5 32 m³/s
- HQ10 39 m³/s
- HQ20 47 m³/s
- HQ50 60 m³/s
- HQ100 70 m³/s
| Date | Mean value [m³/s] | Maximum [m³/s] | Minimum [m³/s] |
|---|---|---|---|
| 09.02.2024 | 0.625 | 0.708 | 0.599 |
| 08.02.2024 | 0.713 | 0.766 | 0.496 |
| 07.02.2024 | 0.479 | 0.496 | 0.448 |
| 06.02.2024 | 0.505 | 0.546 | 0.496 |
| 05.02.2024 | 0.564 | 0.599 | 0.546 |
| 04.02.2024 | 0.629 | 0.652 | 0.546 |
| 03.02.2024 | 0.632 | 0.708 | 0.599 |
© Bayerisches Landesamt für Umwelt 2024