

Chart of year Triftern / Altbach
Discharge from 01.01.2024 to 25.04.2024
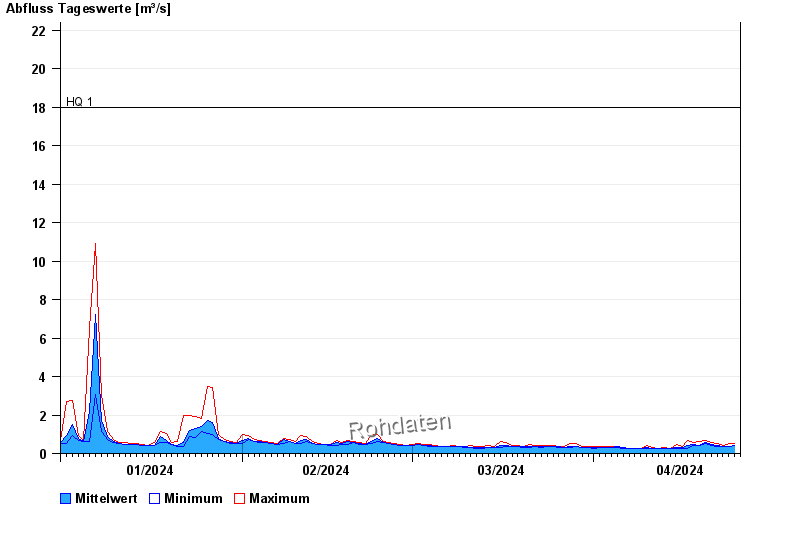
- HQ1 18 m³/s
- HQ2 23 m³/s
- HQ5 32 m³/s
- HQ10 39 m³/s
- HQ20 47 m³/s
- HQ50 60 m³/s
- HQ100 70 m³/s
| Date | Mean value [m³/s] | Maximum [m³/s] | Minimum [m³/s] |
|---|---|---|---|
| 25.04.2024 | 0.466 | 0.496 | 0.401 |
| 24.04.2024 | 0.381 | 0.496 | 0.358 |
| 23.04.2024 | 0.358 | 0.401 | 0.358 |
| 22.04.2024 | 0.41 | 0.496 | 0.358 |
| 21.04.2024 | 0.457 | 0.546 | 0.401 |
| 20.04.2024 | 0.559 | 0.652 | 0.496 |
| 19.04.2024 | 0.432 | 0.599 | 0.401 |
© Bayerisches Landesamt für Umwelt 2024