
- Start >
- Rivers >
- Discharge >
- Inn >
- Teisendorf >
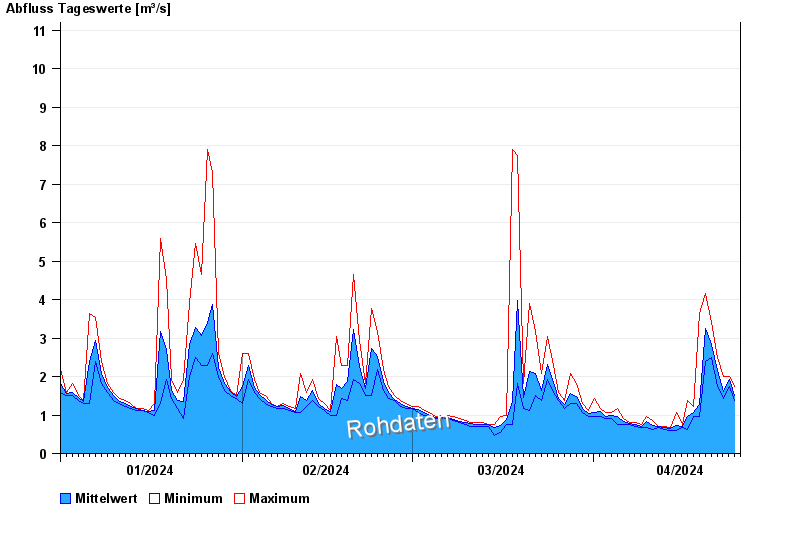
- Chart of year

Chart of year Teisendorf / Sur
Discharge from 01.01.2024 to 25.04.2024
- 04.08.2020 Abfluss: 92 m³/s
- 12.08.2002 Abfluss: 79,6 m³/s
- 02.06.2013 Abfluss: 57,8 m³/s
- 26.06.1995 Abfluss: 53,8 m³/s
- 12.06.1971 Abfluss: 53 m³/s
| Date | Mean value [m³/s] | Maximum [m³/s] | Minimum [m³/s] |
|---|---|---|---|
| 25.04.2024 | 1.62 | 1.73 | 1.51 |
| 24.04.2024 | 1.92 | 2 | 1.73 |
| 23.04.2024 | 1.6 | 2 | 1.43 |
| 22.04.2024 | 2.15 | 2.49 | 1.73 |
| 21.04.2024 | 2.82 | 3.41 | 2.49 |
| 20.04.2024 | 3.25 | 4.15 | 2.39 |
| 19.04.2024 | 1.28 | 3.65 | 0.95 |
© Bayerisches Landesamt für Umwelt 2024