
- Start >
- Rivers >
- Discharge >
- Inn >
- Teisendorf >
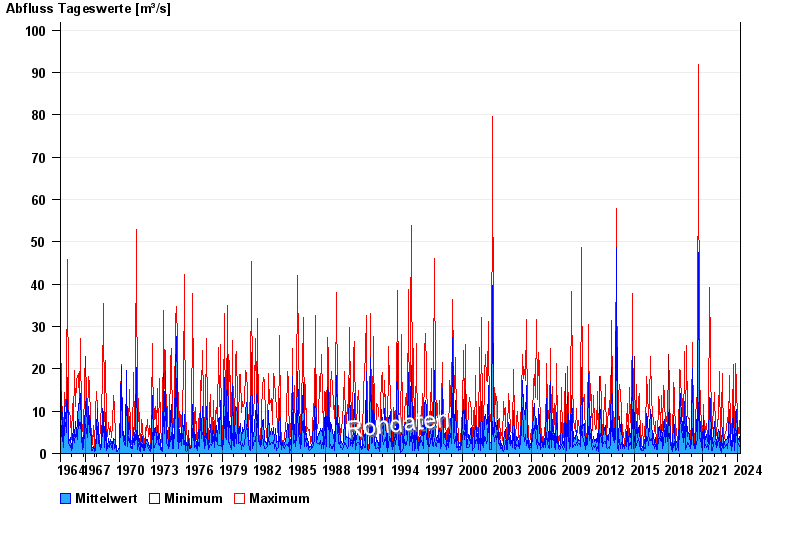
- Chart of total period

Chart of total period Teisendorf / Sur
Discharge from 01.11.1964 to 16.04.2024
| Date | Mean value [m³/s] | Maximum [m³/s] | Minimum [m³/s] |
|---|---|---|---|
| 16.04.2024 | 0.699 | 0.758 | 0.672 |
| 15.04.2024 | 0.736 | 1.06 | 0.587 |
| 14.04.2024 | 0.644 | 0.672 | 0.587 |
| 13.04.2024 | 0.668 | 0.713 | 0.628 |
| 12.04.2024 | 0.699 | 0.713 | 0.672 |
| 11.04.2024 | 0.737 | 0.849 | 0.628 |
| 10.04.2024 | 0.837 | 0.95 | 0.672 |
© Bayerisches Landesamt für Umwelt 2024