

Chart of year Simbach / Simbach
Discharge from 01.01.2019 to 31.12.2019
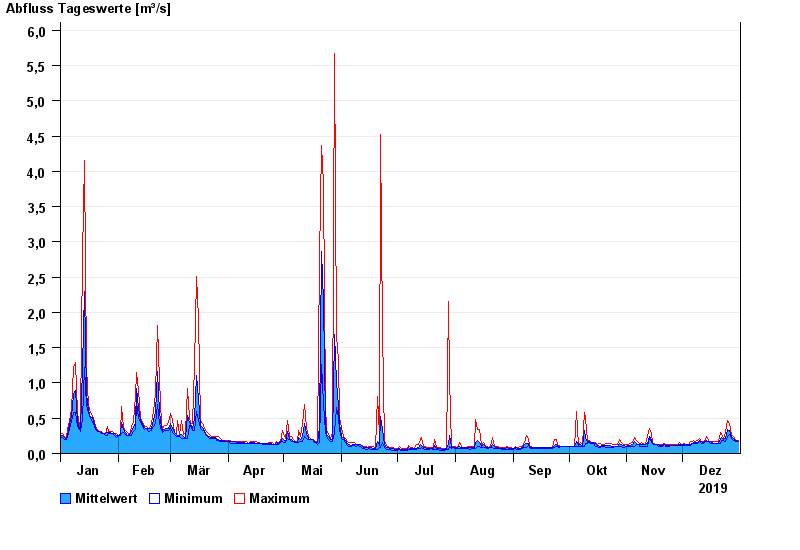
| Date | Mean value [m³/s] | Maximum [m³/s] | Minimum [m³/s] |
|---|---|---|---|
| 31.12.2019 | 0.172 | 0.189 | 0.166 |
| 30.12.2019 | 0.186 | 0.189 | 0.166 |
| 29.12.2019 | 0.195 | 0.213 | 0.188 |
| 28.12.2019 | 0.211 | 0.238 | 0.188 |
| 27.12.2019 | 0.242 | 0.266 | 0.212 |
| 26.12.2019 | 0.328 | 0.431 | 0.265 |
| 25.12.2019 | 0.346 | 0.47 | 0.238 |
© Bayerisches Landesamt für Umwelt 2024