

Chart of year Simbach / Simbach
Discharge from 01.01.2022 to 31.12.2022
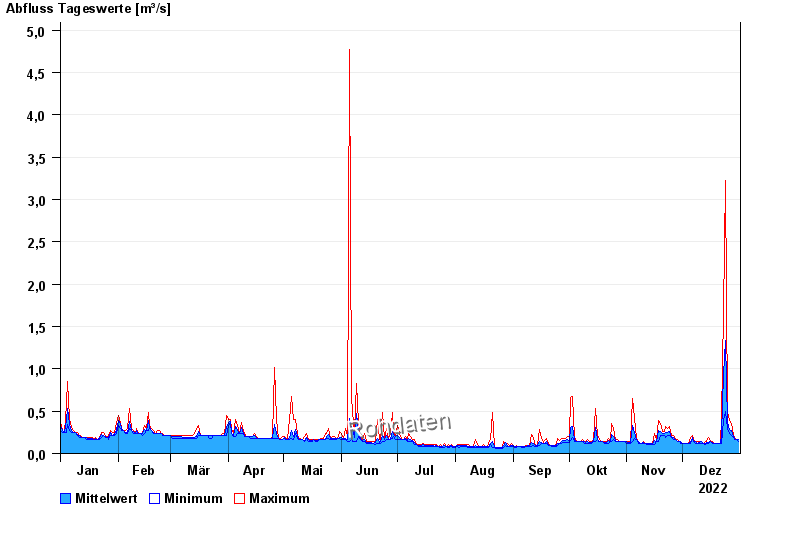
| Date | Mean value [m³/s] | Maximum [m³/s] | Minimum [m³/s] |
|---|---|---|---|
| 31.12.2022 | 0.161 | 0.162 | 0.142 |
| 30.12.2022 | 0.162 | 0.162 | 0.162 |
| 29.12.2022 | 0.179 | 0.185 | 0.162 |
| 28.12.2022 | 0.2 | 0.208 | 0.185 |
| 27.12.2022 | 0.274 | 0.353 | 0.208 |
| 26.12.2022 | 0.279 | 0.387 | 0.234 |
| 25.12.2022 | 0.366 | 0.502 | 0.29 |
© Bayerisches Landesamt für Umwelt 2024