

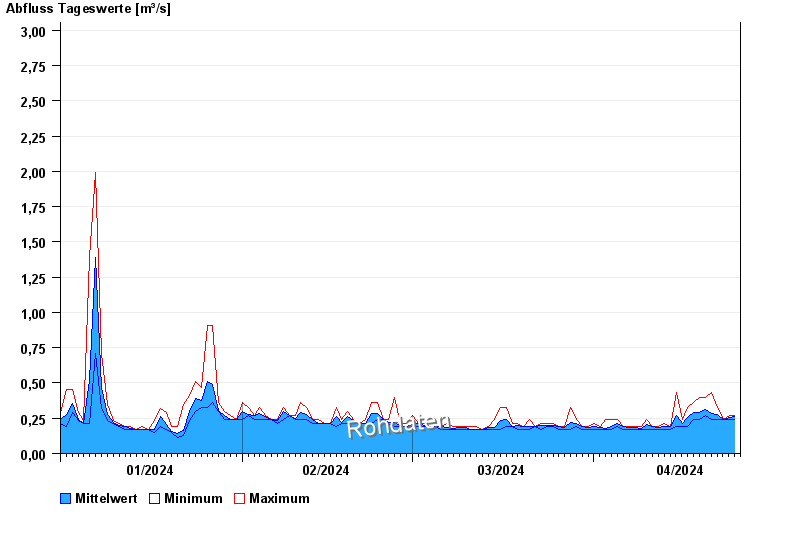
Chart of year Simbach / Simbach
Discharge from 01.01.2024 to 25.04.2024
- 10.07.1999 Abfluss: 50,1 m³/s
- 01.08.1991 Abfluss: 24,7 m³/s
- 10.06.2007 Abfluss: 24,5 m³/s
- 02.03.1987 Abfluss: 24,3 m³/s
- 02.08.1991 Abfluss: 23,8 m³/s
| Date | Mean value [m³/s] | Maximum [m³/s] | Minimum [m³/s] |
|---|---|---|---|
| 25.04.2024 | 0.262 | 0.269 | 0.241 |
| 24.04.2024 | 0.255 | 0.269 | 0.241 |
| 23.04.2024 | 0.241 | 0.241 | 0.241 |
| 22.04.2024 | 0.274 | 0.328 | 0.241 |
| 21.04.2024 | 0.285 | 0.431 | 0.241 |
| 20.04.2024 | 0.31 | 0.395 | 0.269 |
| 19.04.2024 | 0.29 | 0.395 | 0.241 |
© Bayerisches Landesamt für Umwelt 2024